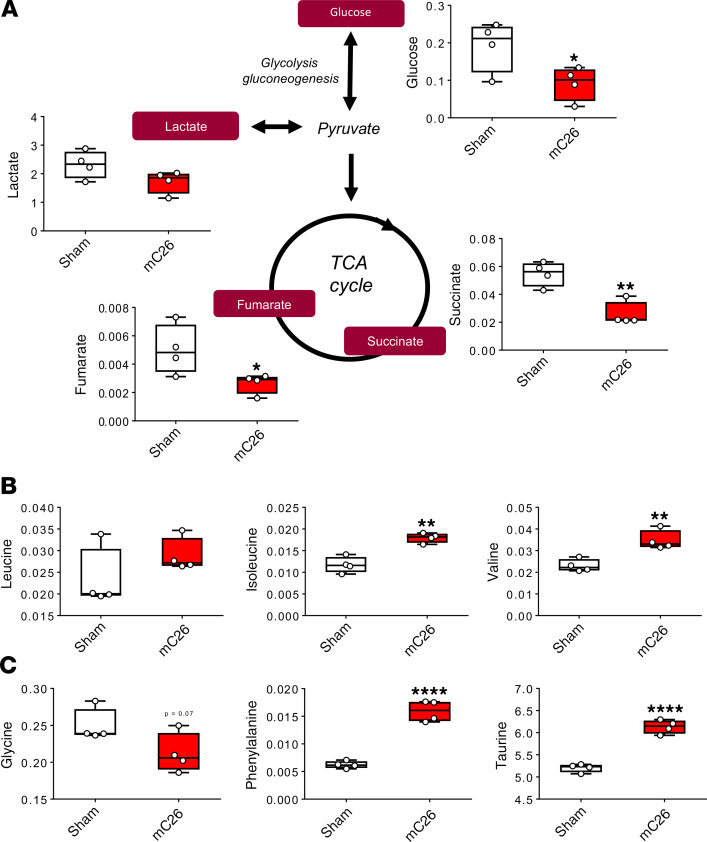
Figure 6. Skeletal muscle of mC26 hosts display compromised metabolome.
(A) Representative diagram of glycolysis and tricarboxylic acid (TCA) cycle showing metabolite concentrations (mM) in skeletal muscle of CD2F1 male mice (12 weeks old) intrasplenically injected with C26 tumor cells (250,000 cells/mouse in sterile PBS, mC26) or an equal volume of vehicle (Sham) (n = 4). (B and C) Branch chain amino acid (leucine, isoleucine, and valine) concentrations expressed in mM (B) and glycine, phenylalanine, and taurine concentrations (in mM) (C) of sham and mC26 hosts. Data are expressed as means ± SD. Two-tailed t tests were used to determine differences between Sham and mC26. Significance of the differences: *P < 0.05, **P < 0.01, ****P < 0.0001 versus Sham.

