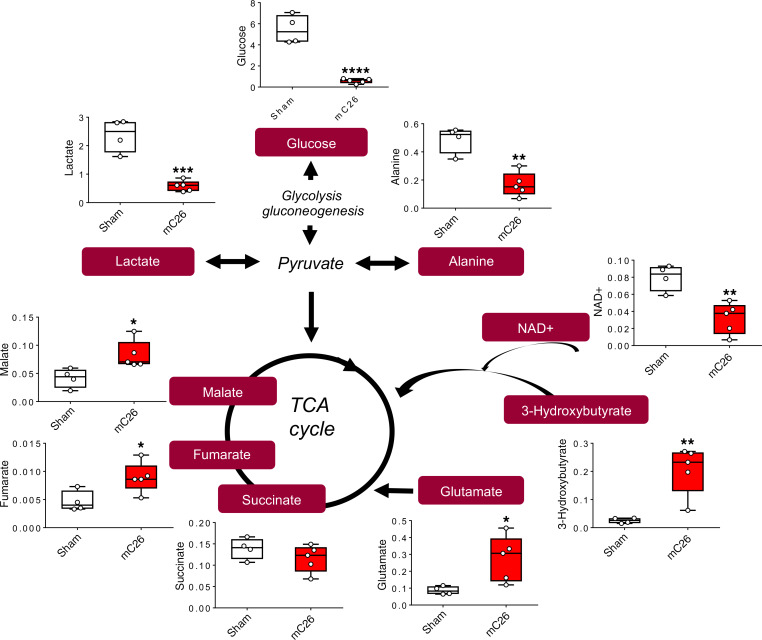
Figure 8. mC26 hosts have altered liver metabolome.
Representative diagram of glycolysis and tricarboxylic acid (TCA) cycle showing metabolite concentrations (mM) in livers of CD2F1 male mice (12 weeks old) intrasplenically injected with C26 tumor cells (250,000 cells/mouse in sterile PBS, mC26) or an equal volume of vehicle (Sham) (n = 4-5). Data are expressed as means ± SD. Two-tailed t tests were used to determine differences between Sham and mC26. *P < 0.05, **P < 0.01, ***P < 0.001, ****P < 0.0001 versus Sham.

