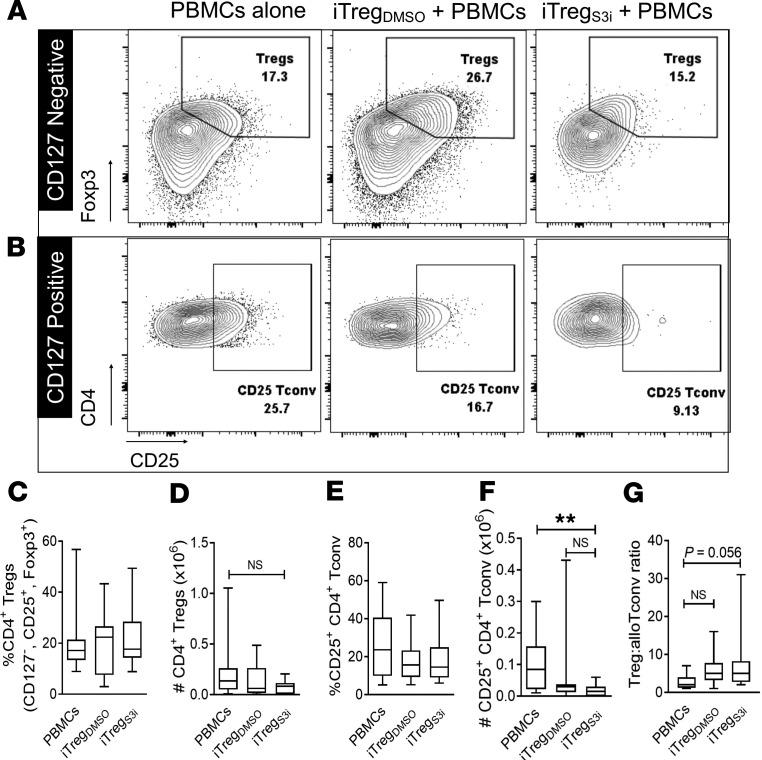
Figure 6. Human pSTAT3–inhibited iTregs reduce the amount of alloreactive Tconv.
NSG mice received a human skin graft, allogeneic PBMCs, and pSTAT3-inhibited (S3i) or control iTregs. On day +21, the recipient spleens were harvested and analyzed for human Treg (CD4+, CD127–, CD25+, Foxp3+) and activated Tconv (CD4+, CD127+, CD25+). (A and B) Representative contour plots are shown. Box-and-whisker plots (max, min, median) demonstrate the frequency and absolute numbers of human Tregs (C and D) and activated Tconv (E and F). (G) Graph (max, min, median) shows the ratio of Treg to activated Tconv within the recipient spleens on day +21. n = 3 experiments, up to 11 mice/group. ANOVA (C–G). *P < 0.05. pSTAT3, STAT3 phosphorylation; iTregs, induced Tregs; Tconv, conventional T cells.

