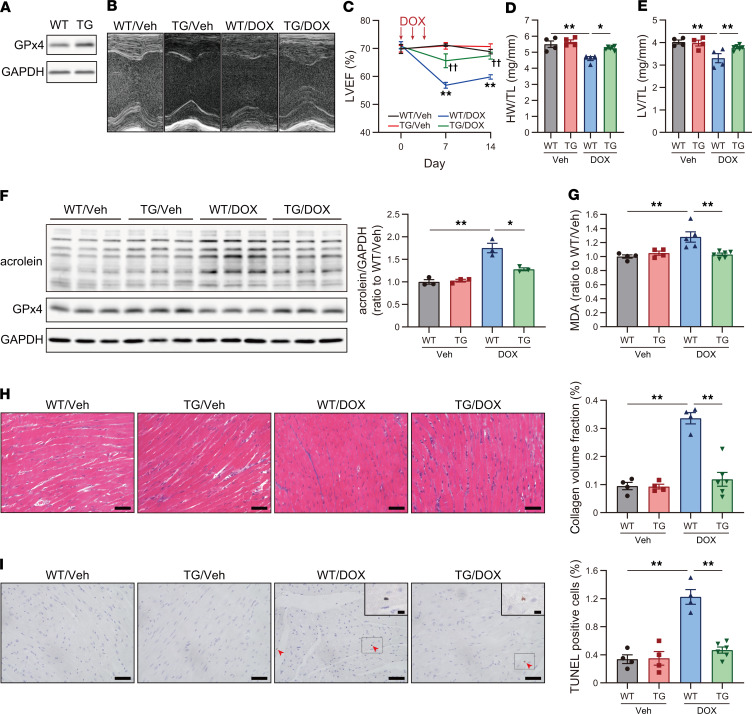
Figure 2. GPx4 overexpression ameliorates DIC.
(A) Western blot of GPx4 in heart tissue lysates from WT and GPx4 Tg mice. (B) Echocardiographic images of WT and GPx4 Tg mice, treated with vehicle (Veh) or doxorubicin (DOX), at day 14. (C) LVEF (n = 4–6). **P < 0.01 vs. WT/Veh. ††P < 0.01 vs. WT/DOX. Statistical significances at day 7 and 14 were determined using 1-way ANOVA with a post hoc Tukey’s HSD test. (D) Heart weight, normalized by tibial length (TL) at day 14 (n = 4–6). (E) Left ventricle (LV) weight, normalized by TL at day 14 (n = 4–6). (F) Western blot of acrolein and GPx4 in heart tissue lysates at day 14 (n = 3, each group). (G) Malondialdehyde (MDA) in the myocardium at day 14 was measured by thiobarbituric acid reactive substances (TBARs) assay (n = 4–6). (H) Interstitial fibrosis in the LV evaluated using Masson trichrome staining in WT and Tg mice treated with Veh or DOX. Scale bar: 50 μm (n = 4–6). Quantification of interstitial fibrosis, assessed by collagen volume fraction (%, interstitial fibrosis per total myocardium) (right panel). (I) TUNEL staining in WT and Tg mice treated with Veh or DOX. Scale bar: 50 μm (n = 4–6). Arrowheads indicate TUNEL+ nuclei. Representative image of TUNEL+ cells at a high power (upper right panel). Scale bar: 10 μm (n = 4–6). Data are shown as the mean ± SEM. Statistical significance was determined using 1-way ANOVA with a post hoc Tukey’s HSD test. *P < 0.05, **P < 0.01.

