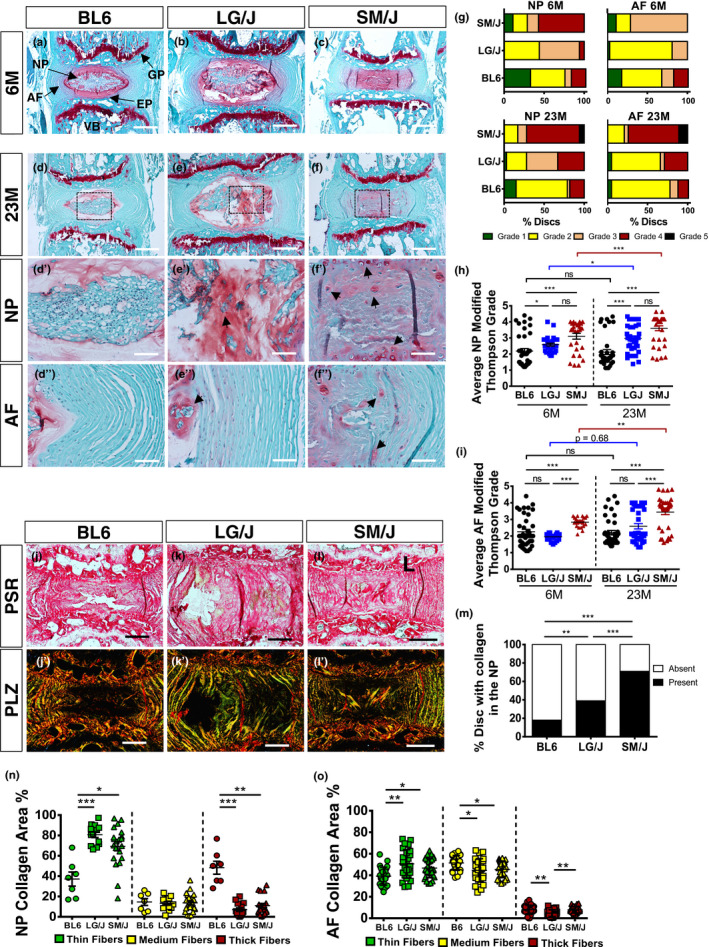
FIGURE 2.

Inbred strains show distinct disc phenotypes during aging. (a‐f’’) Histology of 6M and 23M mice showed differences in tissue architecture and cell morphology in the NP, AF and EP. Panels d', e' and f' show the area enclosed in dotted boxes in panels d, e and f, respectively. (g‐i) Modified Thompson Grading distribution and averages showed small degenerative changes in LG/J mice and BL6 but high degenerative grades in SM/J mice at 6M. At 23M, both LG/J and SM/J mice showed higher degenerative grades than BL6 mice in the NP. (j‐m) Picro‐Sirius Red staining and polarized microscopy of discs (n‐o) Analysis of percentage of thin (green), intermediate (yellow) and thick fibres (red). Mann–Whitney test was used for comparing 6M to 23M in each strain. Kruskal–Wallis and chi‐squared test were used to perform comparison between the 3 strains. BL6 (n = 10), LG/J (n = 14) and SM/J (n = 8), 4 levels per strain were analysed. Scale bar A‐F and J‐L’= 200 µm; Scale bar d’‐f = 50 µm. AF, annulus fibrosus; EP, endplate; GP, growth plate; NP, nucleus pulposus; VB, vertebra
