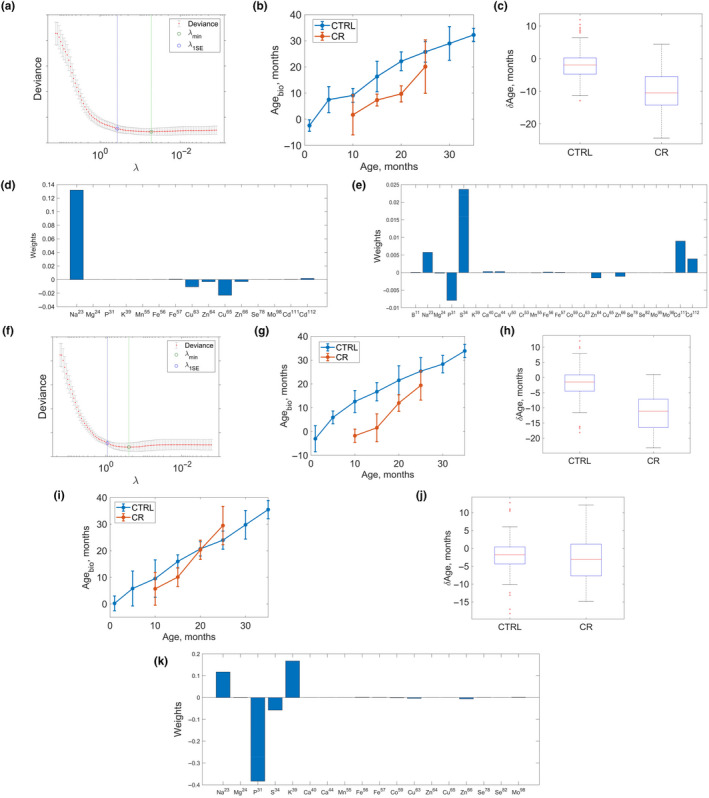
Figure 5.

Ionome‐based biomarkers of age in mice. (a) Building the ionome marker of age for mouse kidney. Marker deviance is a function of Tikhonov regularization parameter λ (see Methods). λ min corresponds to the minimum of deviance as a function of λ. Deviance itself is identified with error which can be determined performing cross‐validation. The value λ 1 SE corresponds to the deviance 1 standard error away from λ min. (b) Pace of the ionome biological marker of age based on mouse kidney. Biological age of control samples is shown in blue and calorie restriction (CR) samples in red. (c) Difference between chronological ages of mice from which the samples were collected and their biological ages as determined by the kidney ionome clock. The biological age of CR mice is lower on average by 10 months than that of control mice, p = .03 (one‐sided two sample t test). (d) Weights of different elements in the linear combination representing the kidney ionome marker of age. (e) The same for the pancreas ionome clock. (f) Building the ionome marker of age for mouse pancreas, deviance is a function of Tikhonov regularization parameter λ. (g) Pace of the pancreas ionome biological marker of age. The biological age of control samples as a function of their chronological age is shown in blue and that of CR mice in red. (h) Same as Figure 5c, but for the pancreas. The biological age of CR mice was lower on average by 8 months, p = .01 (one‐sided two sample t test). (i) Same as (b) and (g), but for the testis. (j) Same as (c) and (h), but for the testis. (k) Same as (d) and (e), but for the testis
