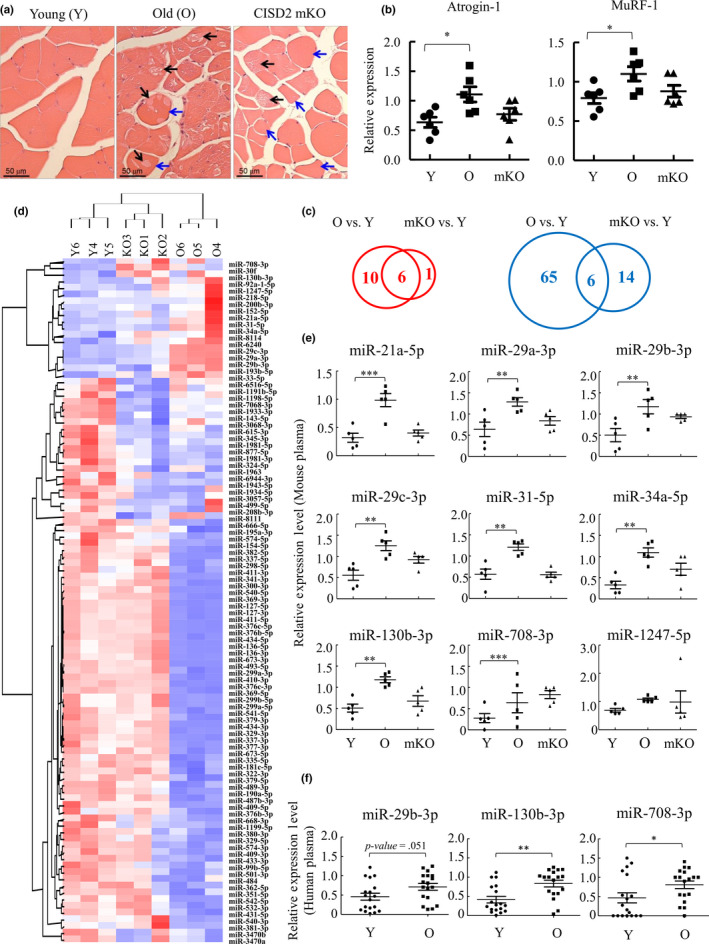
Figure 1.

Identification of miRNAs that are increased in atrophied muscle and in plasma of aged mice and humans. (a) Hematoxylin–eosin (HE) staining of quadriceps femoris muscles from 3‐month (Young, Y)‐ and 26‐month (Old, O)‐old wild‐type mice and 3‐month‐old CISD2 muscle‐specific knockout (mKO) mice revealed degeneration (black arrows) and cellular shrinkage (blue arrows) in the skeletal muscles of naturally aged and CISD2 mKO mice. (b) RT‐qPCR analysis of Atrogin‐1 and MuRF‐1 mRNA using femoris muscle RNA isolated from mice described in (a) (n = 6). (c) Venn diagram showing the number of the miRNAs up (left panel, red)‐ and down (right panel, blue)regulated in aged and CISD2 mKO muscle (RPKM > 1, fold change > 1.5x) (n = 3). (d) Hierarchical clustering of the 102 miRNAs shown in (c). Each column represents the miRNA expression in Y, O, and CISD2 mKO muscle. (e) Plasma RNA isolated from Y, O, and CISD2 mKO mice (n = 5) was subjected to RT‐qPCR. 9 miRNAs were detected in mouse plasma. (f) Plasma RNA isolated from young (21–30 years old) and old (71–80 years old) human subjects (n = 18) was subjected to RT‐qPCR. miR‐708‐3p and miR‐130b‐3p were significantly increased in plasma of elderly, and miRNA‐29b‐3p was increased with borderline statistical significance (p = .051). *p < .05, **p < .01, ***p < .001 by one‐way ANOVA
