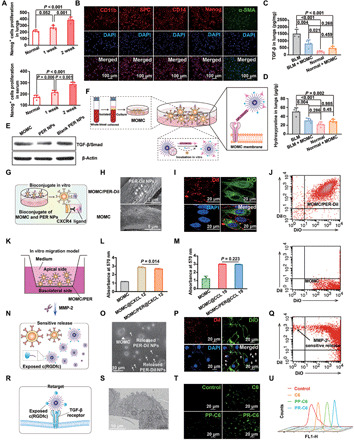
Fig. 2. The PER NPs can adhere to MOMC and pathology responsively release and then be internalized by A549 in vitro.

(A) The proliferation of Nanog+ cells in serum and lung tissues by ELISA assay. (B) The MOMC phenotypes. The level of TGF-β (C) and hydroxyproline (D) in IPF lung tissues, respectively. (E) The level of TGF-β/Smad in vitro. (F) Schematic showing the preparation of MOMC/PER. (G) Schematic showing the adhesion of PER NPs to MOMC. (H) SEM images of MOMC and MOMC/PER-DiI. (I) Fluorescent signals of MOMC and PER-DiI NPs by CLSM. (J) The adhesion between MOMC and PER-DiI NPs by flow cytometry. (K) In vitro migration model. The migration ability of MOMC and MOMC/PER in CXCL 12 (L) and CCL 19 (M), respectively. (N) Schematic showing sensitive release of MOMC/PER-DiI triggered by MMP-2. (O) Characterizations by TEM. MOMC is the triangle, and PER-DiI NPs are the arrows. (P) Fluorescent images of MOMC and released PER-DiI NPs by CLSM. (Q) The flow cytometry showed responsive release. (R) Schematic showing the retarget ability of released PER NPs. (S) Characterization of retargeting ability by TEM. (T) The fluorescent images by CLSM. (U) Cellular uptake in A549 by flow cytometry (n = 3). Statistical significance was calculated via one-way analysis of variance (ANOVA).
