
Fig. 4. Schematic representation of the performance of PER NPs.
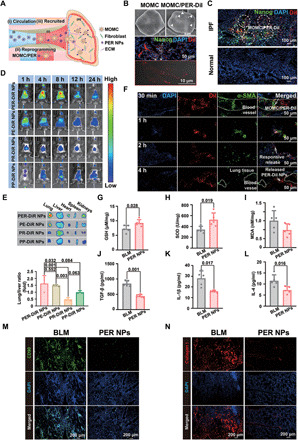
(A) Schematic of PER NPs circulation in vivo, reprogramming of MOMC/PER, and recruitment to IPF tissue. (B) The targeting ability of PER-DiI NPs. (C) The accumulation of PER-DiI NPs in normal and IPF lungs. (D) Fluorescence IVIS imaging (n = 3). (E) Ex vivo fluorescence imaging and quantification of major organs (n = 3). (F) The accumulation PER-DiI NPs in the lungs at different times. Lung function indexes of GSH (G), SOD (H), and MDA (I). TGF-β (J), IL-1β (K), and IL-4 (L) by ELISA assay (n = 5). (M) Proliferation of fibroblasts. (N) Expression of collagen I. Statistical significance was calculated via one-way ANOVA.