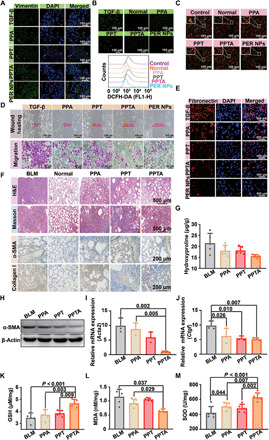
Fig. 5. Antifibrosis mechanism with dual drugs synergy.

(A) Expression of the vimentin in vitro. (B) The ROS level in vitro. (C) The changes of mitochondrial membrane potential. (D) Invasion assay. (E) Fibronectin expression. (F) H&E, Masson, and IHC staining. (G) The level of hydroxyproline. (H) The α-SMA and β-actin by Western blotting. The mRNA expression of Acta2 (I) and Ctgf (J) by qPCR (n = 3). Contents of GSH (K), MDA (L), and SOD (M) (n = 5). Statistical significance was calculated via one-way ANOVA.
