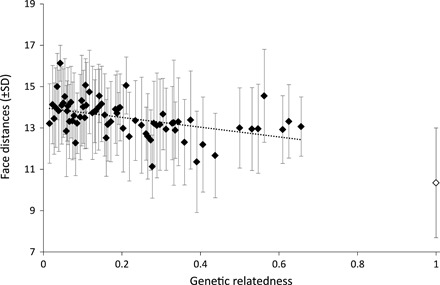
Fig. 2. Genetic relatedness and face distance.

Mean raw face distances (±SD) across the different values of relatedness observed across 38 adult females. For scaling, we represented the averaged face distance obtained from pictures taken on the same females (i.e., intraindividual resemblance, open diamond). For the sake of clarity and for illustrative purposes, we depicted a regression line based on these averaged relatedness values. SDs are provided rather than SEM to depict the full range of variation of face distances.
