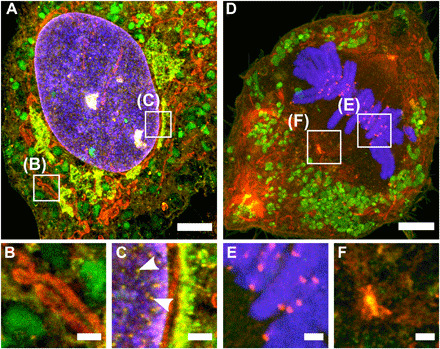
Fig. 2. FLARE staining of hydrogel-expanded cultured cells.

Confocal microscopy images of hydrogel-expanded RPE cells that have been covalently stained for amine (red) and carbohydrate (green) using FLARE along with a conventional noncovalent stain for DNA (blue). (A) Interphase cell showing various subcellular organelles including mitochondria (red), lysosomes (green), and perinuclear structures (yellow). (B and C) Zoomed-in views of boxed regions in (A). Arrowheads in (C) indicate nuclear pores. (D) Dividing cell showing various subcellular organelles. (E and F) Zoomed-in views of boxed region in (D) showing kinetochores and centrosomes, respectively. All scale bars are in preexpansion units. Scale bars, 3 μm (A and D) and 500 nm (B, C, E, and F).
