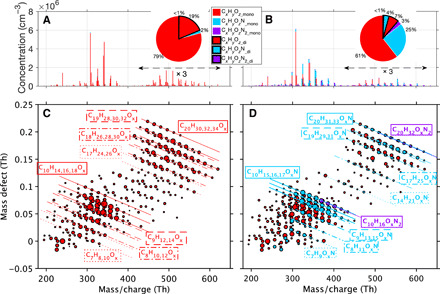
Fig. 2. Gas-phase HOMs under zero and 1.9 ppbv NOx conditions measured by CI-APi-TOF in the CLOUD chamber.

(A and B) The spectra of HOMs colored by their types. The pie charts give the fractional contribution of different types of HOMs. (C and D) Mass defect plots showing HOM composition under the two conditions. The x axis is the exact mass of HOMs, and the y axis is the mass defect. The color of circles denotes the type of HOMs, and their size is proportional to the logarithm of the count rate. Each straight line represents a group of compounds with the same number of carbon, hydrogen, and nitrogen but different numbers of oxygen atoms. The line style is the same as that used for the annotation frame.
