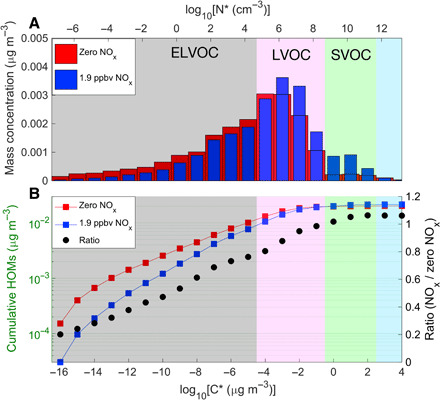
Fig. 4. Volatility distribution of gas-phase HOMs under zero and 1.9 ppbv NOx conditions.

(A) The summed HOM concentrations of each bin. (B) The cumulative HOM concentrations. Red and blue markers denote HOM concentrations under zero and 1.9 ppbv NOx, respectively. The black dots give the ratio of cumulative concentrations of [HOM]NOx:[HOM]w/o NOx.
