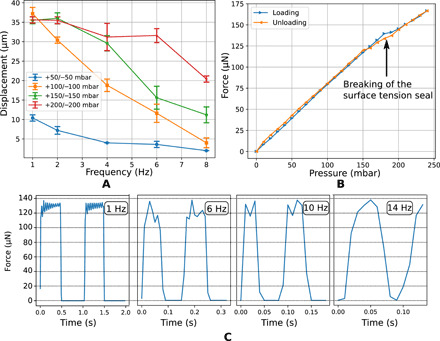
Fig. 4. Displacement and force characterization of the micropiston for different pressure inputs and frequencies.

(A) Amplitude of the micropiston at different frequencies and with different supplied pressure differences. Each data point is derived from the average amplitude of five full cycles of actuation, and the associated error bar of each data point shows the SD. (B) Graph of the force measured at the piston tip during a loading/unloading pressure cycle. (C) Graph of the force measured at the piston tip actuated by an input pressure with a square waveform at various frequencies (1, 6, 10, and 14 Hz). Intermediate frequency is available in section S1.
