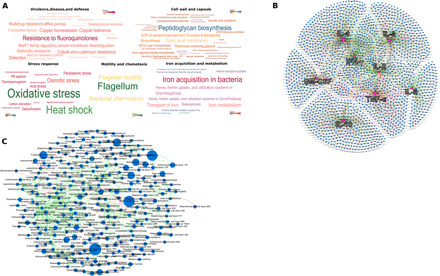
Fig. 1. Phylogenetic, functional, and immune characteristics of the subgingival microbiome of e-cigarette users.

(A) Word map of the predominant microbial functions identified in e-cigarette users. The functions are colored by relative abundances (as indicated by the color map scale within each word map). (B) Network plot between eight immune mediators and the microbial metagenome, with the cytokines at the center of each hub. Interspecies networks are shown in (C). Each network graph contains nodes (circles sized by relative abundance per group) and edges (lines). Nodes represent cytokines and microbial genes in (B) and species-level OTUs in (C) and edges represent Spearman’s rho. In both network graphs, green edges indicate positive correlations and red edges indicate negative correlations. Only edges with correlation coefficient (Spearman’s rho) ≥ 0.80 and P < 0.05 are shown. The data supporting this figure can be found in table S1.
