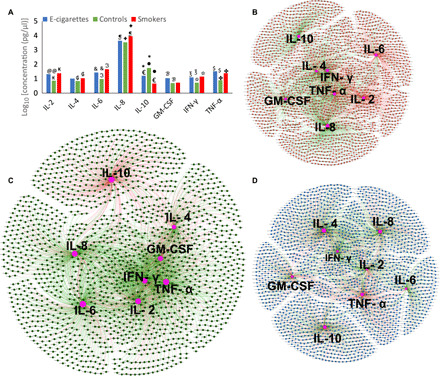
Fig. 3. Inflammatory burden imposed by the e-cigarette–influenced microbiome.

Levels of selected immune mediators in periodontally and systemically healthy nonsmokers (green), smokers (red), and e-cigarette users (blue) is shown in (A). The y axis represents log10-transformed concentrations. Bars with the same symbol are significantly different (P < 0.05, Dunn’s test). Co-occurrence networks between cytokines and microbial genes in each group are shown in (B to D). Smokers are shown in (B), nonsmokers in (C), and e-cigarette users in (D). Each network graph contains nodes (circles) and edges (lines). Nodes represent cytokines and KEGG-annotated genes, and edges represent Spearman’s rho. Edges are colored green for positive correlation and red for negative correlation. Only significant correlations (P < 0.05, t test) with a coefficient of at least 0.80 are shown.
