. 2020 Apr 27;9:e56301. doi: 10.7554/eLife.56301

Figure 4. Initial characterization of pgk1- / - mutants and genetic mosaics.

(A–F) Cross sections through the anterior/vestibular region of the otic vesicle (outlined) showing expression of the indicated genes in wild-type embryos and pgk1- / - mutants at the indicated times. (G–J) Lateral views showing isl2b-Gfp expression in live embryos at 30 hpf (G, H) and fgf3 at 24 hpf (I, J). The otic vesicle is outlined. (K–P) Cross sections through the otic vesicle (outlined) showing positions of lineage labeled wild-type cells (red dye) transplanted into a wild-type host (K, M, O) or a pgk1- / - mutant host (L, N, P). Sections are co-stained with DAPI (M, N) and etv5b probe (O, P). Note the absence of etv5b expression in wild-type cells transplanted into the mutant host (P). (Q) Number of mature Isl1+ SAG neurons at 30 hpf in embryos with the indicated genotypes, except for sagd1 x pgk1 intercross expected to contain roughly 25% each of +/+, sagd1/+, pgk1/+ and sagd1/pgk1 embryos. (R) Percent of wild-type donor cells located in the ventral half of the otic vesicle expressing etv5b in wild-type or pgk1- / - hosts. A total of 151 wild-type donor cells were counted in eight otic vesicles of wild-type host embryos, and 247 wild-type donor cells were counted in eight otic vesicles of pgk1- / - host embryos. (S) Number of Isl1+ SAG neurons (total, anterior and posterior) in wild-type and pgk1- / - mutant embryos at 36 hpf (n = 12), 48 hpf (n = 12) and 120 hpf (n = 4). (T) Number of phalloidin-stained hair cells (anterior/utricular and posterior/saccular) in wild-type and pgk1- / - mutant embryos at 36 hpf (n = 16), 48 hpf (n = 16) and 120 hpf (n = 10). Sample sizes are indicated (S, T).

Figure 4.

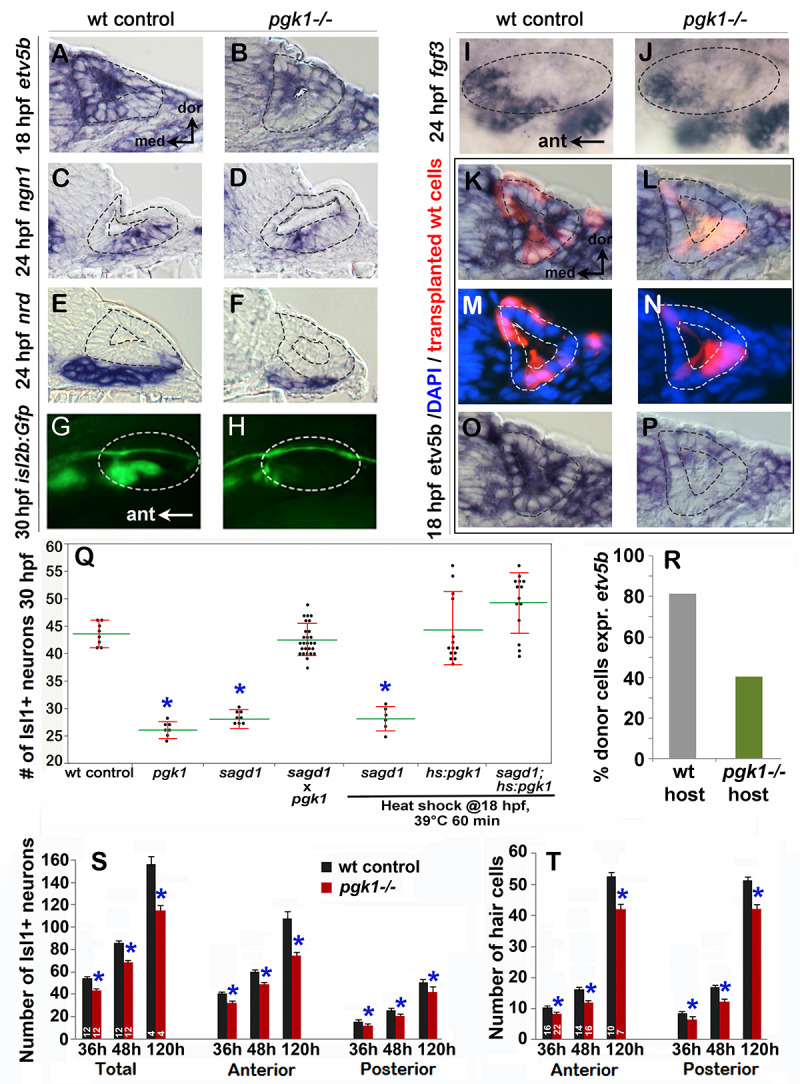
Figure 4—figure supplement 1. pgk1– / - mutants show normal onset of fgf3 and fgf8a, but not pax5, in the otic vesicle.

Figure 4—figure supplement 1.

(A–D) Expression of fgf3 and pax5 in wild-type and pgk1- / - mutant embryos at 18 hpf. fgf3 (A, B) is expressed in rhombomere 4 (r4) and pharyngeal endoderm (pe) and appears normal in pgk1- / - mutants, while otic expression of pax5 (C, D, arrows) is reduced in mutant embryos. (E–H) At 19 hpf, expression of fgf3 (E, F) and fgf8a (G, H) is reliably detected in the otic vesicle (arrows) and appears normal in pgk1- / - mutants. Images show dorsal views with anterior to the top.
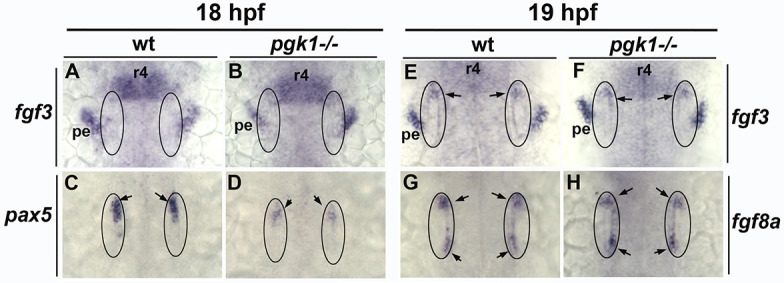
Figure 4—figure supplement 2. pgk1– / - mutants show normal expression of regional markers of the otic vesicle.

Figure 4—figure supplement 2.

(A–H) Otic expression of the indicated genes at 24 hpf in wild-type embryos and pgk1- / - mutants. Images show dorsolateral views with anterior to the left.
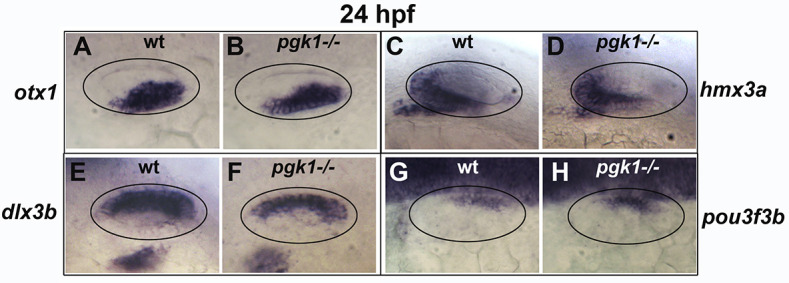
Figure 4—figure supplement 3. Deficiencies in Fgf-dependent cell types in pgk1- / - mutants.

Figure 4—figure supplement 3.

(A–D) Expression of neurod at 24 hpf showing lateral views of the olfactory epithelium (olf) (A, B) and dorsal views of the facial (fac) and glossopharyngeal (glos) ganglia (C, D) in wild-type and pgk1- / - embryos. Numbers indicate relative surface area of each expression domain (normalized to wild-type controls)± standard deviation and number of specimens. Expression domains are significantly smaller in pgk1- / - mutants (p<0.0001). (E, F) Dorsal view (anterior to the top) of anti-acetylated tubulin staining in the hindbrain region in a wild-type embryo (E) and pgk1- / - mutant (F). Positions of reticulospinal neurons (rsn) and trigeminal ganglia (tg) are indicated. Numbers indicate the mean number of neurons per side ± standard deviation and number of specimens. The number of neurons is significantly reduced in pgk1- / - mutants (p<0.0001).
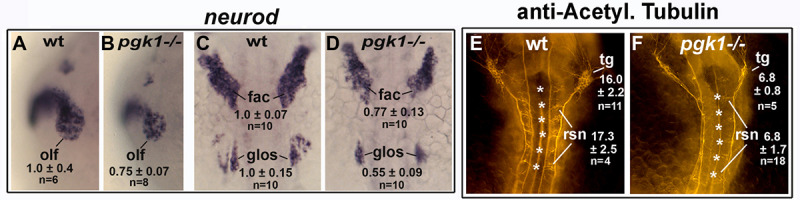
Figure 4—figure supplement 4. Misexpression of pgk1-alt does not rescue pgk1- / - mutants but does rescue pgk1-alt morphants.

Figure 4—figure supplement 4.

(A, B) Mean (green) and standard deviation (red) of Isl1+ SAG neurons. (A) The number of SAG neurons at 32 hpf is reduced in pgk1- / - mutants but is not affected by activation of hs:pgk1-alt. (B) The number of SAG neurons at 30 hpf is reduced in pgk1-alt morphants but is restored to normal following activation of hs:pgk1-alt at 18 hpf.
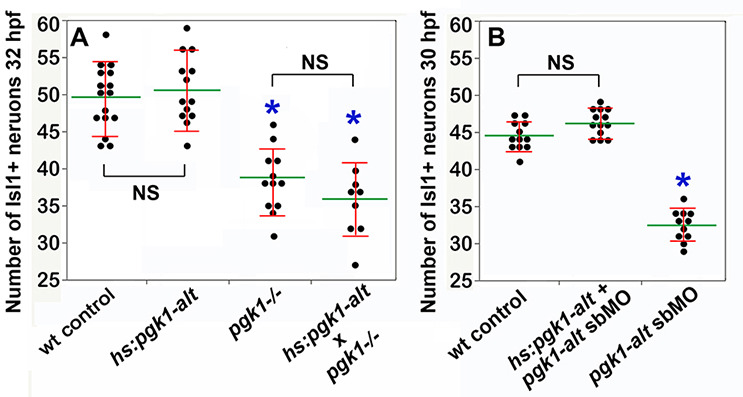
Figure 4—figure supplement 5. Fgf signaling is not required for normal pgk1-FL expression.

Figure 4—figure supplement 5.

(A–D’) Dorsal views (anterior to the top) of expression of pgk1-FL and etv5b in wild-type embryos incubated with 0.5% DMSO or 50 uM SU5402 from 20 to 22 hpf. Images show whole embryos next to enlargements (primed letters) of the indicated regions of the hindbrain. SU5402 had no effect on expression of pgk1-FL but completely eliminated expression of etv5b.
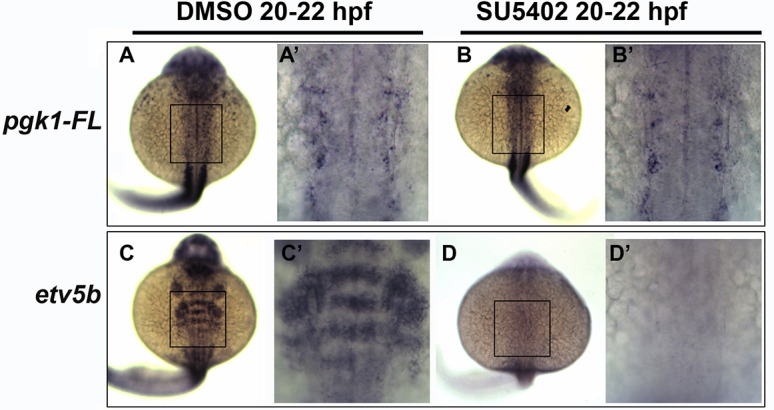
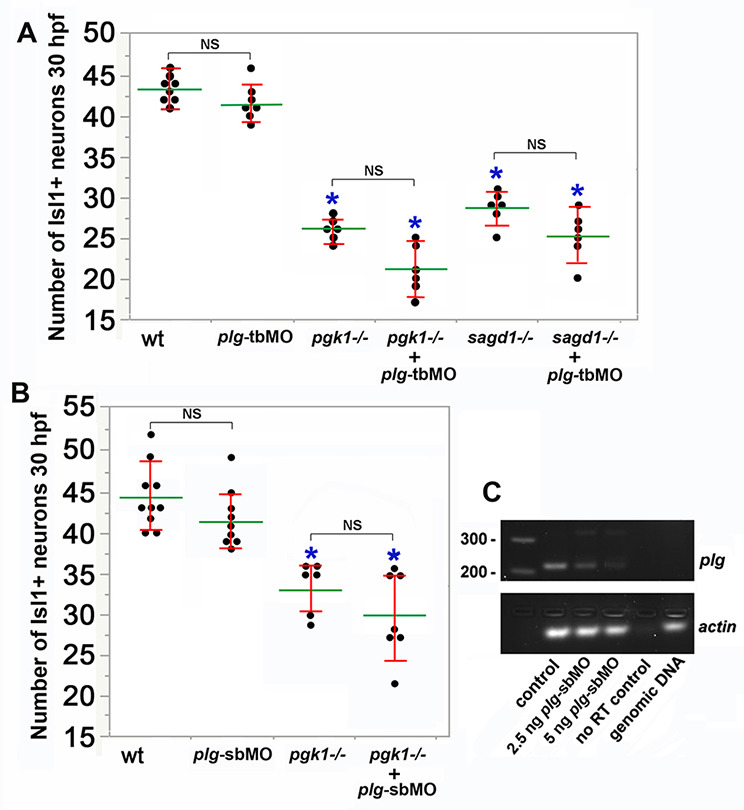
Figure 4—figure supplement 6. Knockdown of plasminogen does not alter pgk1- / - or sagd1- / - phenotypes.

Figure 4—figure supplement 6.

(A, B) Mean (green) ± standard deviation (red) of the number of Isl1+ SAG neurons at 30 hpf in embryos with the indicated genotypes and/or following injection of 5 ng plg translation-blocker (plg-tbMO) (A) or splice-blocker (plg-sbMO) (B). Asterisks indicate significant differences from wild-type controls. NS, no significant difference between groups indicated in brackets. (C) RT-PCR of plg transcript harvested at 24 hpf from wild-type controls or embryos injected with 2.5 or 5 ng plg-sbMO. As controls, reverse transcriptase was excluded from wild-type mRNA samples (no RT control), or genomic DNA was used as template.