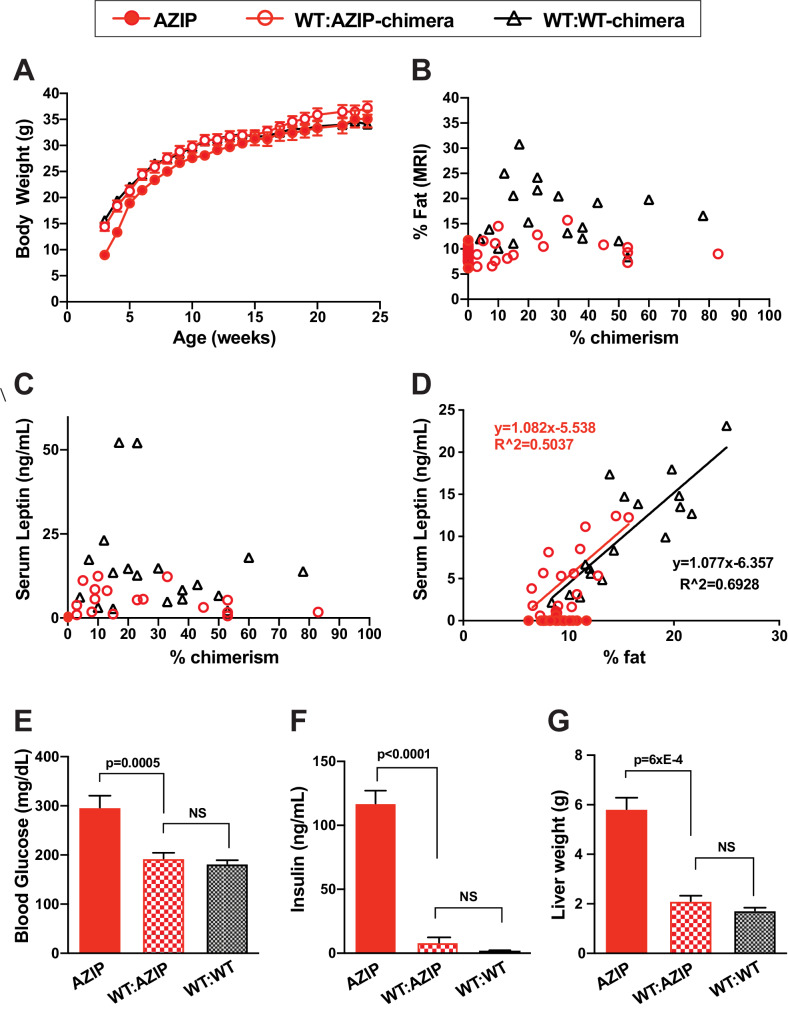
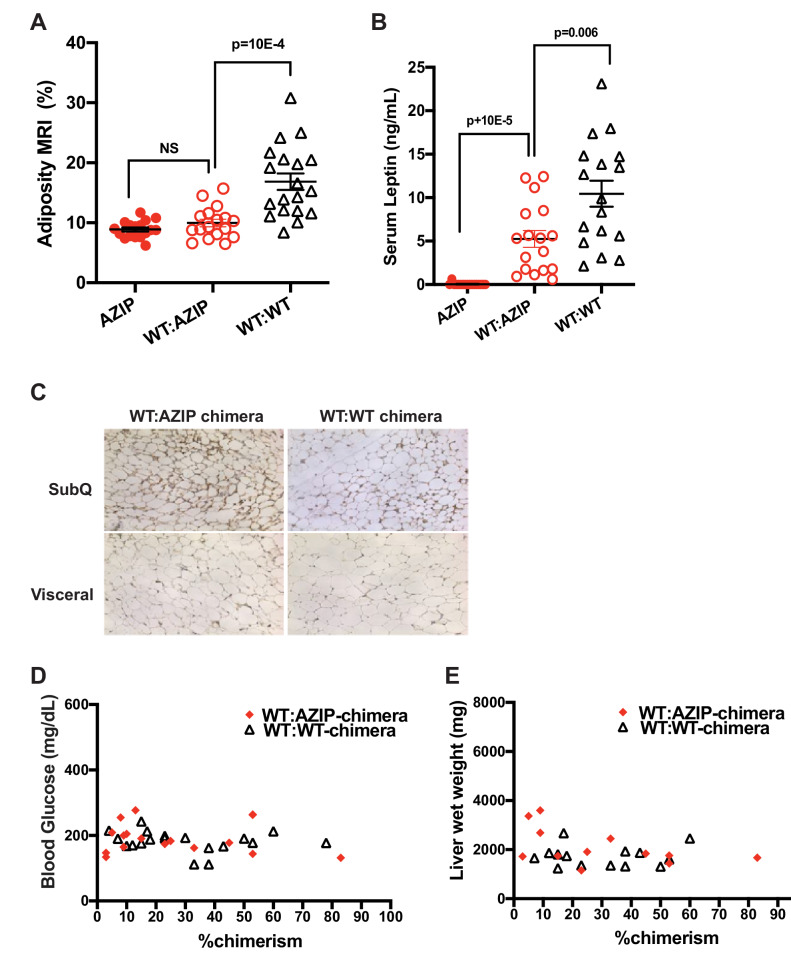
Figure 2. WT:AZIP-Chimeric mice in b6 background have normalized adiposity and fully complemented metabolic parameters on chow diet.
(A) Body weight of AZIPs (solid red), WT:AZIP-chimeras (open red), and WT:WT-chimeras (black triangle) from 3 weeks to 24 weeks old. No difference in body weight was observed between WT:AZIP- and WT:WT-chimeras at all ages measured, except for AZIP mice that show significantly lowered body weight at weaning age (3 and 4 weeks old) but no difference is detected afterwards. (B) Body fat content measured by MRI at 12 weeks versus chimerism. There were no significant differences between AZIP and WT:AZIP-chimeric mice but WT:AZIP-chimeric mice are generally leaner than WT:WT-chimeric mice. (C) Serum leptin levels versus chimerism. AZIP mice have non-detectable levels of leptin and WT:AZIP-chimeras show serum leptin levels ranging from 0.6 to 12.5 ng/mL that is intermediate to AZIPs and WT:WT chimeras. No correlation is seen between chimerism and leptin levels in WT:AZIPs and WT:WTs. (D) Serum leptin and percent fat content correlate well in both WT:AZIP- and WT:WT-chimeras. There is no significant difference between the slopes of the two linear regressions. Two statistical outliers of WT-chimera with high leptin were excluded. Together, the results show that AZIP-chimeras form adipose tissue with normal leptin production despite a general reduction in adiposity. (E) Blood glucose levels at 12 weeks old. AZIPs are significantly higher than WT:AZIP and WT:WT-chimeras (297 ± 24 mg/dL for AZIPs vs. 193 ± 11 mg/dL for WT:AZIPs p=0.0005) and WT:AZIPs and WT:WT were the same (193 ± 11 mg/dL for WT:AZIPs vs 182 ± 7 mg/dL for WT:WTs, p=0.4). (F) Insulin level at 12 weeks. AZIP hyperinsulinemia was rescued in WT:AZIP-chimeras, from 117 ± 10 ng/mL to 8.2 ± 3.6 ng/mL (p<0.0001). (G) Liver weight. Liver weight is normalized by complementation (5.8 ± 0.5 for AZIPs vs 2.1 ± 0.2 g in WT:AZIPs; p=6xE-4 and 1.7 ± 0.1 g for WT:WTs). For (A) to (F), n = 17 for AZIP, n = 17 for WT:AZIP, and n = 19 for WT:WT-chimeras. For (G), n = 9 for AZIP, n = 12 for WT:AZIP and n = 14 for WT-chimeras, and liver analysis are performed at 6 months old.


