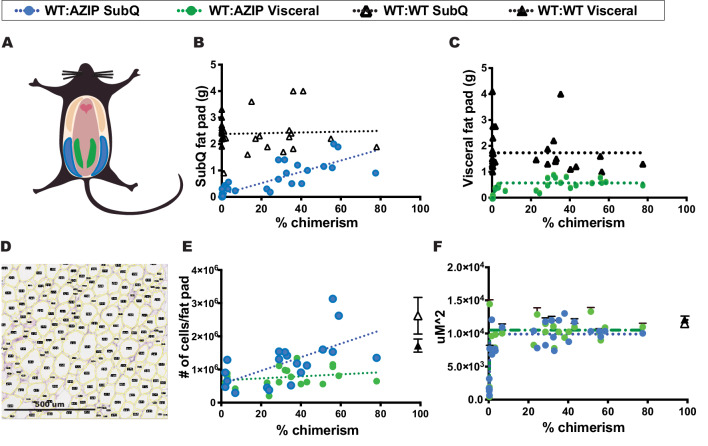
Figure 4. In high-fat-diet animals, the size of subcutaneous and visceral fats stores are differentially controlled.
(A) Schematic representation of subcutaneous and visceral fat pads. Subcutaneous fat pads, shown in blue, and visceral fat pads, shown in green. (B) Subcutaneous fat pad mass vs. chimerism. Subcutaneous fat mass increases with increasing chimerism in WT:AZIP-chimeras (blue circles; linear regression Y = 0.02134*X+0.09579, R^2 = 0.7147) but not in WT:WT-chimeras (black triangles; linear regression Y = 0.001482*X+2.377, R^2 = 0.002). (C) Visceral fat pad mass vs. chimerism. Visceral fat pad mass is independent of chimerism in both WT:AZIP-chimeras (green circles) and in WT:WT-chimeras (black triangles). (D) Images of 5 uM fixed H and E stained adipocytes run through Fiji Adiposoft for individual size determination of adipocytes. Scale shown. (E) Number of cells per fat pad vs. chimerism. Number of subcutaneous adipocytes per fat pad increased with increasing chimerism (blue circles; 1/slope of the linear regression is 4.900e-005 with an R^2 = 0.3737; Y = 20361*X+555585) whereas visceral adipocytes do not (green circles; 1/slope of the linear regression is 3.2e-4, R^2 = 0.05135; Y = 3043*X+671862). WT:WT subcutaneous shown as open black triangle and WT:WT visceral adipocytes as solid black triangle. (F) Average area of top 20 adipocytes per 1,875,000 uM^2 (1500 uM x 1250 uM) image. The size of WT:AZIP adipocytes, both subcutaneous (blue circles) and visceral (green circles) is independent of chimerism. Same results were found for WT:WT chimera adipocytes (black open triangle for subcutaneous adipocytes, black solid triangle for visceral adipocytes). In (A) to (F), AZIPs n = 24, WT:AZIPs n = 21, and WT:WT n = 30. Data collected at 24 weeks after 18 weeks of HFD.

