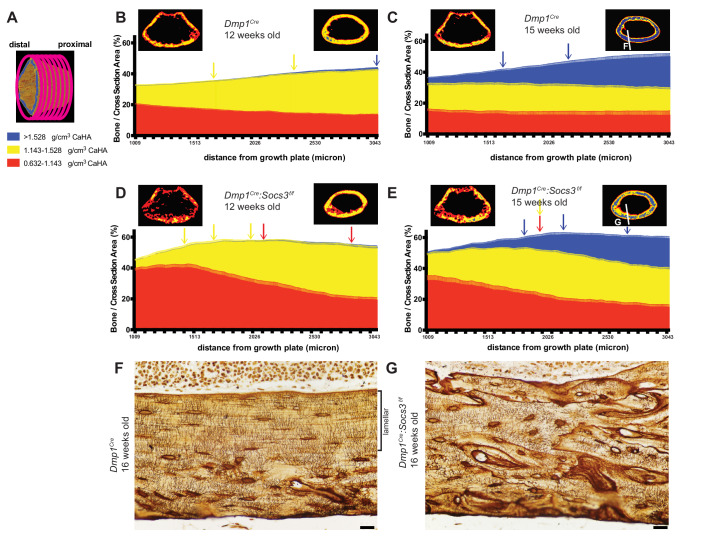
Figure 3. Bone becomes more mineralized with age, and with increasing distance from the growth plate in Dmp1Cre mice; this is delayed in Dmp1Cre: Socs3f/f mice.
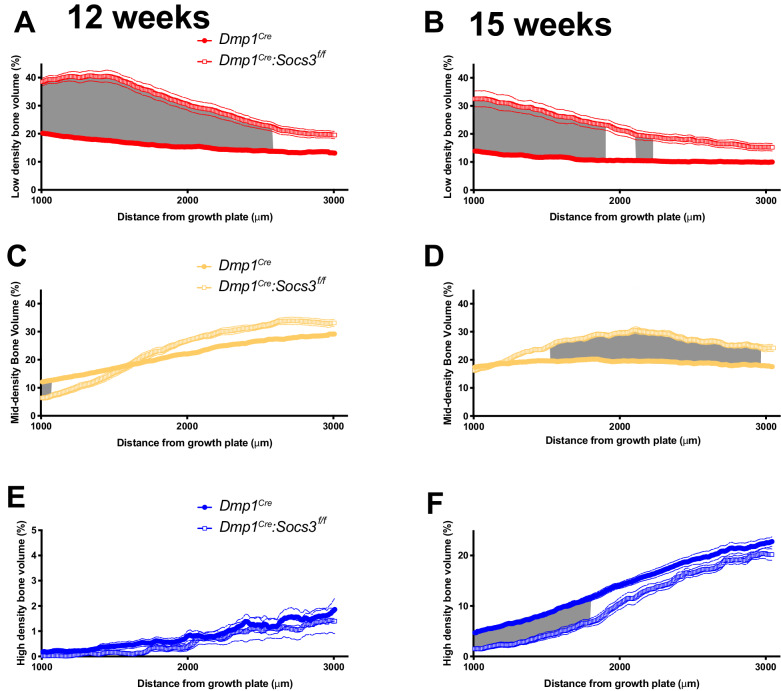
(A) The metaphyseal region was analysed in consecutive 9 micron slices. (B–E) Bone volume at low-, mid-, and high-density mineral levels in each slice from the distal to proximal end of the metaphyseal region at 12 weeks (B,D) and 15 weeks (C,E) of age in Dmp1Cre (B,C) and Dmp1Cre:Socs3f/f mice (D,E). Values are mean+ SEM, n = 9–11 mice per group; arrows denote where data becomes significantly different to the furthest slice from the arrow; colours denote the density level of bone that has changed. Pseudo-colourised images based on the Otsu thresholds show a representative sample for the top and bottom slice for each graph. Differences between genotypes are shown in Figure 3—figure supplement 2. (F,G) Ploton silver stain for osteocyte canaliculi and cement lines at the base of the metaphyseal region cut through the femur as indicated in the inset images of C and E for Dmp1Cre (F) and Dmp1Cre:Socs3f/f mice (G). Scale bar = 20 micron.


