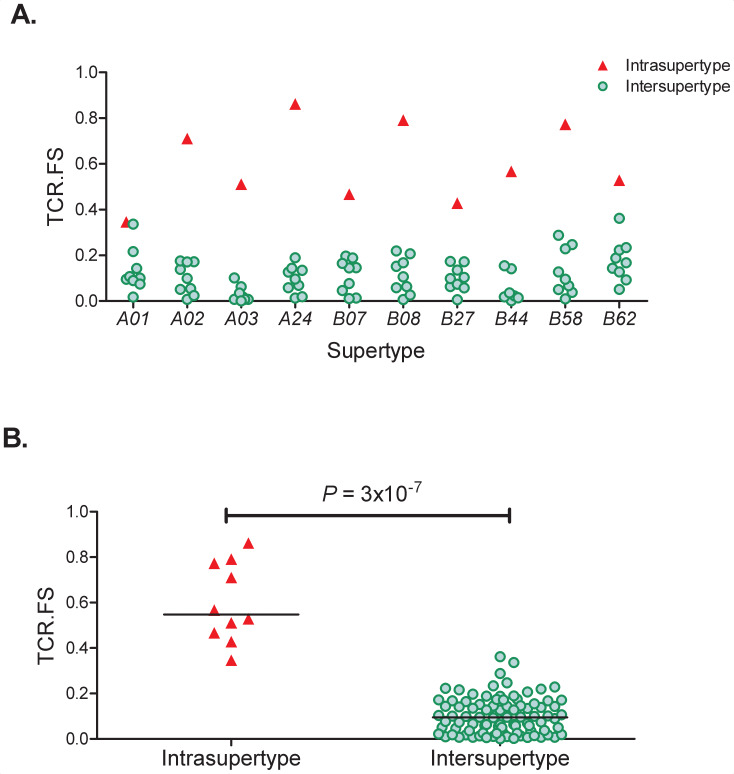
Appendix 4—figure 1. TCR. FS Intra-Supertype and Inter-Supertype.
(A) For each of the 10 supertypes (x axis) we calculated the similarity (median TCR.FS, y axis) to alleles within that supertype (red triangles) and to alleles within all other 9 supertypes (green circles). It can be seen that for every supertype the intra-supertype similarity is larger than all the inter-supertype similarities for that supertype. (B) Pooling the intra-supertype similarities and comparing them with pooled inter-supertype similarities we find that the intra-supertype similarities are significantly higher (p=3×10⁻⁷, Wilcoxon two tailed test), horizontal lines represent the medians of the two groups.

