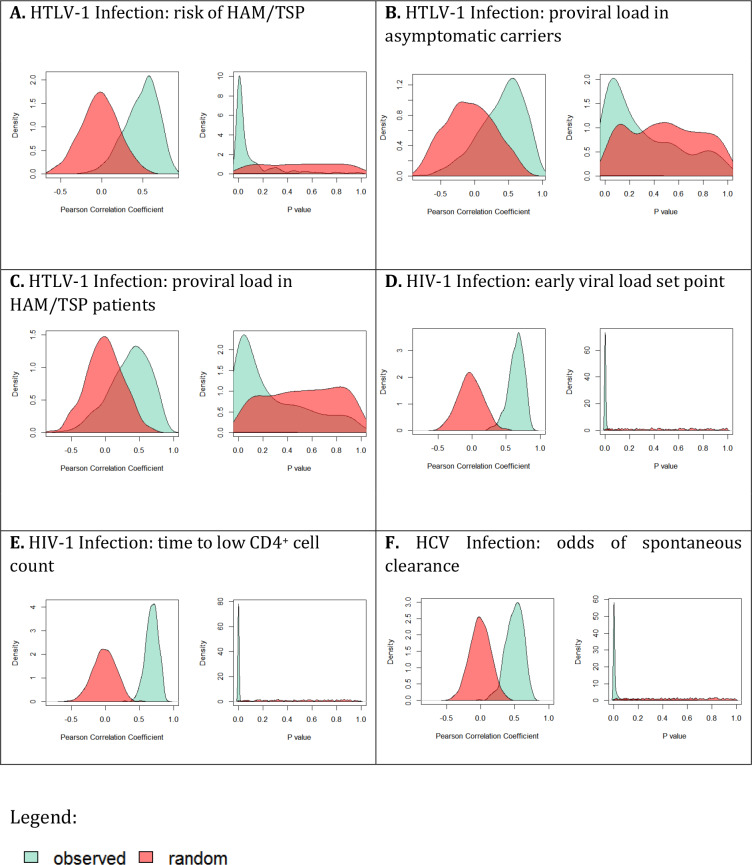
Appendix 4—figure 2. Is the rank order of ‘average’ HLA class I alleles robust?
For each cohort and each outcome measure (panels A-F) the cohort was split in half and the correlation between the protection/susceptibility for the average alleles was calculated using Pearson’s method; this process was repeated 500 times (resulting in 500 correlation coefficients and 500 P values). The distribution of the correlation coefficients (left hand plot in each panel) and the corresponding P values (right hand plot in each panel) was calculated and plotted (green shading). The distributions for randomly paired alleles were also calculated (red shading). In every case the observed distributions were significantly different from random (p<10−16). However, although distinct from random, the observed correlations were not always significant (histogram of green observed P values, right hand plots, contains a number of P values > 0.05). The percentage of runs with P values < 0.05 are as follows: HTLV-1 disease 62.6%, HTLV-1 proviral load asymptomatic carriers 22%, HTLV-1 proviral load HAM/TSP patients 30.6%, IAVI early viral load set point 98.6%, IAVI time to low CD4 count 99.0%, HCV odds of spontaneous clearance 93.8%.

