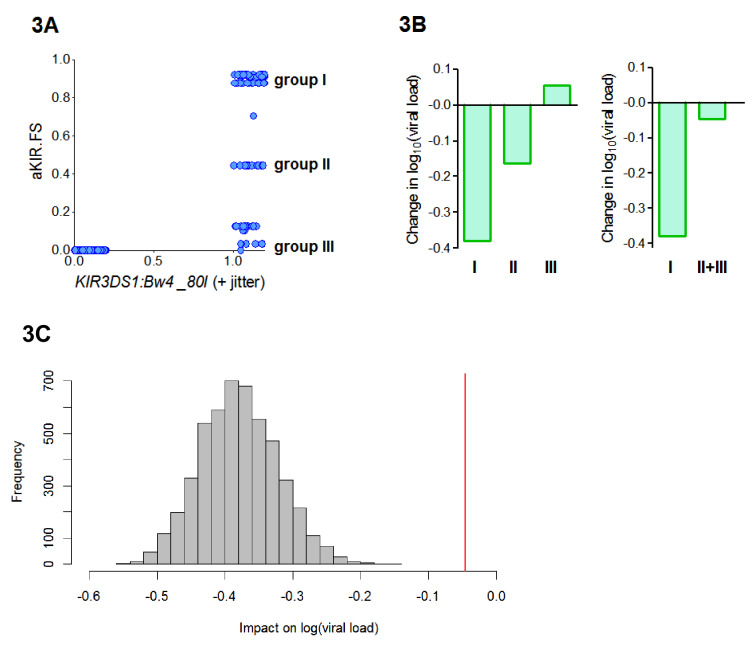
Figure 3. aKIR. FS reveals subtleties within the KIR3DS1:Bw4-80I grouping.
When considering alleles with similar activating KIR binding properties to HLA-B*57 we found that the fraction shared (aKIR.FS) was more informative than the traditional KIR3DS1:Bw4-80I compound genotype grouping. (A) On plotting individuals’ KIR3DS1:Bw4-80I content against their aKIR fraction shared it can be seen that whilst KIR3DS1:Bw4-80I is a simple binary 1 or 0 (people either have the compound genotype or they do not), aKIR.FS has more subtlety and people with KIR3DS1 and Bw4-80I can be segregated into three distinct groups (labelled group I, group II and group III in panel A). These three groupings have different impacts on viral load (i.e. different coefficients in the multivariate regression; B, left hand plot) and only group I is actually significantly protective (Coeff = −0.4 p=0.007 **) although all three groupings have identical KIR3DS1:Bw4-80I status. Group I is larger (N = 47 individuals) than group II (N = 19) or group III (N = 20). To check that lack of significance in group II and group III was not simply due to cohort size we pooled group II and group III (B) right hand plot), group II and III were still not significantly protective. Furthermore, when we downsampled the people in group I so that there were 39 people (i.e. exactly the same size as group II+group III) and calculated the impact on log[viral load] there was never an instance in 5000 runs when the estimated protective effect (decrease in log viral load) was as small as that seen in group II+III. This is illustrated in (C). The grey histogram is the distribution of coefficients seen upon repeated downsampling of group I and the vertical red line is the coefficient associated with group II+III. It can be seen that in 5000 runs the protective effect in the group I individuals far exceeds that in group II+III individuals despite (artificially) matched cohort size. Note in panel A jitter (a random number between 0 and 0.2) has been added to the KIR3DS1:Bw4-80I variable on the x axis since this number only takes value 0 or 1, plotting without jitter simply overlays the datapoints and information about the number of points in the clusters is obscured.

