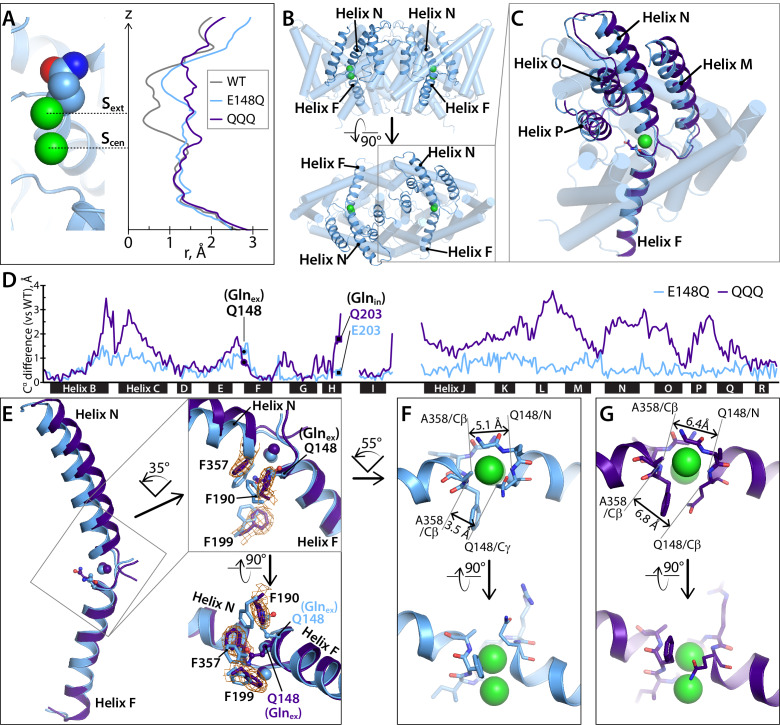
Figure 2. Helices M-N-O-P move to widen the extracellular vestibule.
(A) Comparison of pore radius profiles of CLC-ec1 with Gluex in the ‘middle’ (WT), ‘up’ (E148Q), and ‘out’ (QQQ) positions. The pore-radius profile, calculated using HOLE, is aligned with the structure at left (E148Q) to indicate the position of the Sext and Scen anion-binding sites. (B) Two views of the CLC-ec1 E148Q structure, with ribbons highlighting helices M-N-O-P (helices located in the extracellular half of the protein) and F (located in the intracellular half). (C) Overlay of the CLC-ec1 QQQ structure (purple) with E148Q (blue) following structural alignment using segments of helices B, F, G, and I (residues 35–47, 153–164, 174–190, and 215–223). (D) Plot of the differences in Cα positions between WT CLC-ec1 and QQQ (purple) or between WT and E148Q (blue), based on the B-F-G-I structural alignment. The black bars indicate 17 of the 18 alpha helices. (Density for Helix A is absent in QQQ.) The locations of Glnex and Glnin are marked as solid-black circles and squares, respectively. The differences in the H-I and I-J linkers are not shown here but are discussed below and in Figure 5—figure supplement 2. (E) Zoomed-in view of the structural overlay between CLC-ec1 QQQ and E148Q, showing changes in the positions of conserved residues F190, F199, and F357 and the corresponding electron density from the QQQ structure determination. Additional views are shown in Figure 2—figure supplement 1. (F, G) Illustration of interatom distances at the extracellular bottleneck that are increased in QQQ (G) compared to E148Q (F). Comparisons of Cl– coordination distances are shown in Figure 2—figure supplement 2.
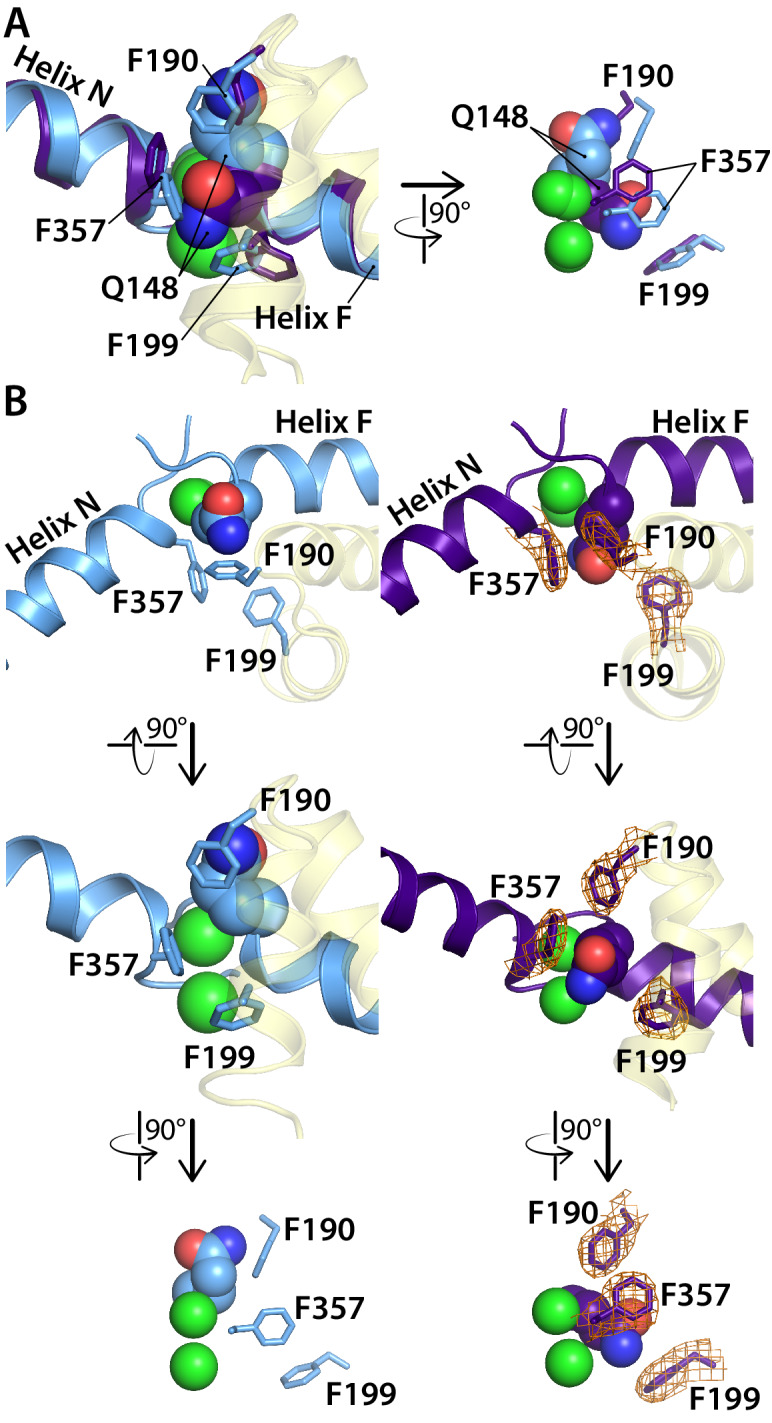
Figure 2—figure supplement 1. Comparison of the CLC-ec1 QQQ structure to the E148Q (Gluex to Gln) structure in the vicinity of the Sext binding site.

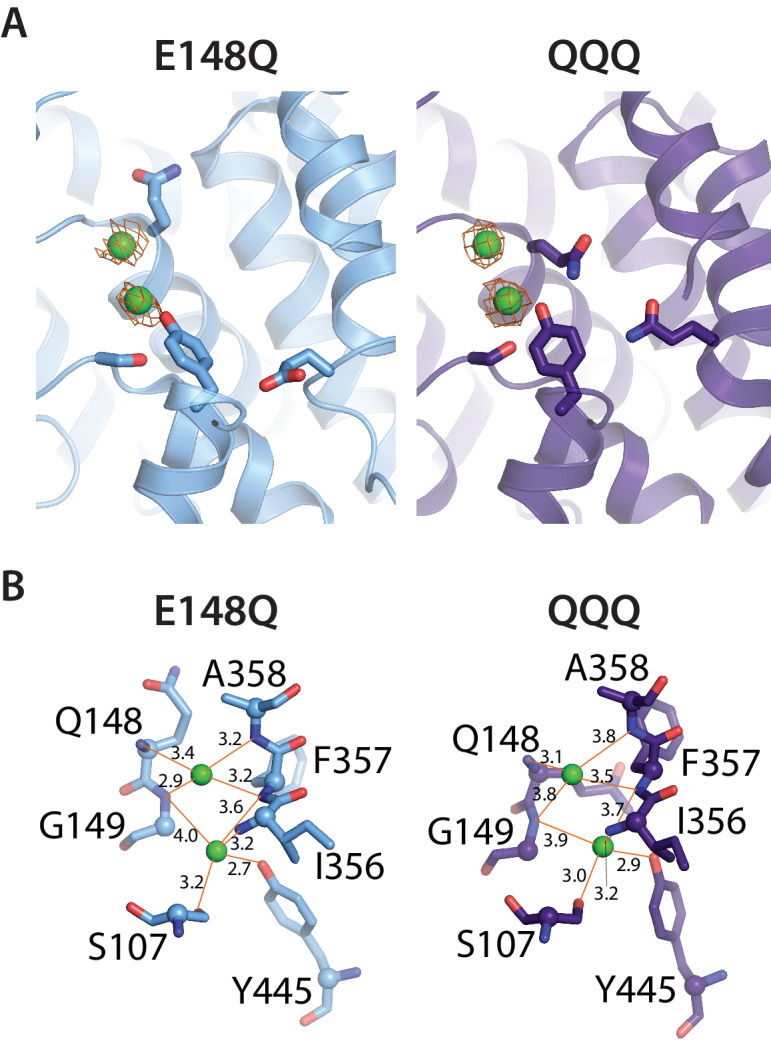
Figure 2—figure supplement 2. Cl– binding sites in QQQ CLC-ec1.


