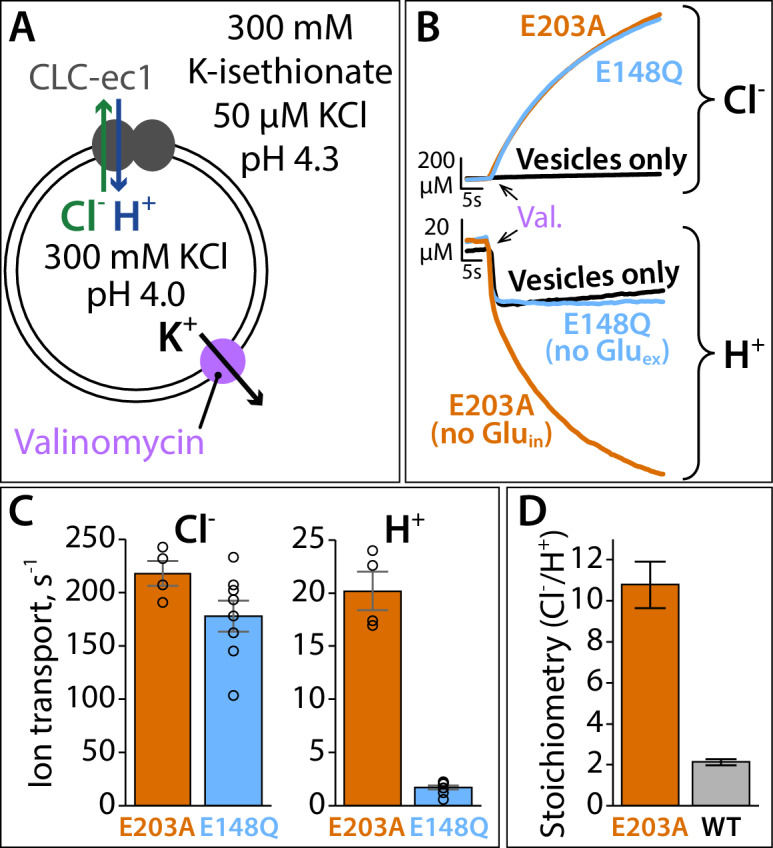
Figure 9. Proton pumping by CLC-ec1 with neutralized Gluin (E203A).
(A) Cartoon depiction of the H+/Cl– flux assay. Extravesicular [Cl–] and [H+] are simultaneously measured using Ag·AgCl and pH electrodes, respectively. The experimental setup involves a 2-fold gradient for H+, such that any leak will involve movement of H+ out of the vesicles, and any H+ movement into the liposomes must occur via transport coupled to the Cl– gradient (pumping). (B) Representative Cl– and H+ traces (upper and lower panels, respectively) for CLC-ec1 mutants with a neutral residue at either Gluin (E203A) or Gluex (E148Q). (C) Summary data showing Cl– and H+ transport rates, average ± SEM. For E203A, n = 4 (samples from two independent protein preparations); for E148Q, n = 8 (samples from four reconstitutions done with protein from three preparations). (D) Cl–/H+ stoichiometry for E203A, with WT CLC-ec1 shown for comparison. Stoichiometry is determined from the ratio of the ion transport rates (panel C). WT samples are from experiments done on the same days as the E203A and mutant samples shown in Figure 9—figure supplement 1, with n = 10 (samples from five reconstitutions done with protein from four preparations).


