FIGURE 3.

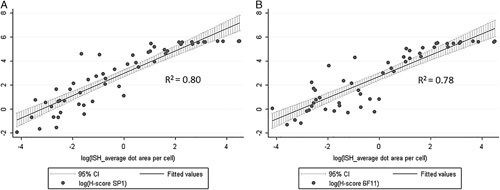
Digital image analysis of mRNA-ISH assay. Relationship between average dot area per cell (mRNA-ISH) and H-score (IHC). The data are log-transformed before linear regression. A, ER antibody clone SP1. B, ER antibody clone 6F11.

Digital image analysis of mRNA-ISH assay. Relationship between average dot area per cell (mRNA-ISH) and H-score (IHC). The data are log-transformed before linear regression. A, ER antibody clone SP1. B, ER antibody clone 6F11.