
Figure 1.
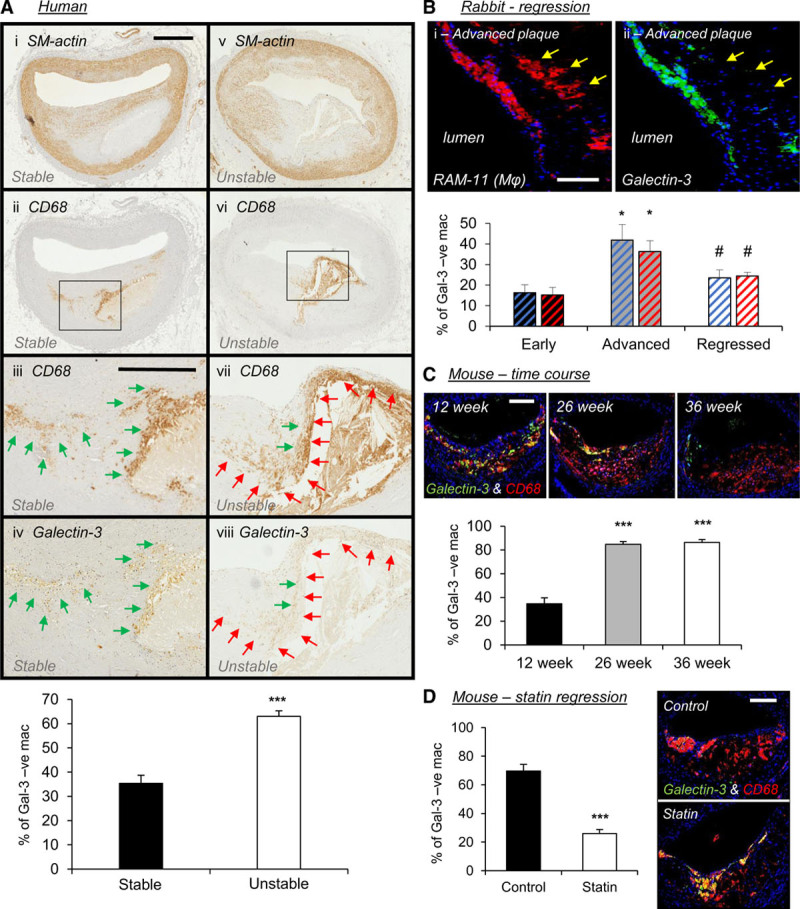
Galectin-3–negative macrophages accumulate in human, rabbit, and mouse advanced atherosclerotic plaques. A, Representative images of smooth muscle cells (SM [smooth muscle]-actin), macrophages (CD [cluster of differentiation]-68), and galectin-3 protein expression by immunohistochemistry and quantification from human stable and unstable coronary atherosclerotic plaques; n=14/group; ***P<0.001; 2-tailed Student t test; scale bar in Ai equates to 1 mm and applies to Ai, Aii, Av, and Avi, scale bar in Aiii equates to 500 µm and applies to Aiii, Aiv, Avii, and Aviii. Black boxes in Aii and Avi represent areas at higher magnification in Aiii and Aiv and Avii and Aviii, respectively. Green arrows indicate regions containing galectin-3–positive macrophages, and red arrows indicate areas with galectin-3–negative macrophages. B, Representative images of a rabbit advanced plaque for macrophages (RAM [rabbit atherosclerosis macrophage]-11, in red) and galectin-3 (in green) protein expression by immunohistochemistry and quantification from male (blue bars) and female (red bars) rabbit early, advanced, and regressed atherosclerotic plaques; n=4/group; *P<0.05 compared with early plaques; #P<0.05 compared with advanced plaques; Kruskal-Wallis nonparametric ANOVA; scale bar in Bi equates to 50 µm and applies to both panels. C, Representative images and quantification of macrophages (CD68, in red), galectin-3 (in green), and merged CD68/galectin-3 (in yellow) protein expression by immunohistochemistry from mouse brachiocephalic lesions from a time-course experiment where Apoe−/− mice were high-fat fed for 12, 26, and 36 wk; n=10/group; ***P<0.001 compared with 12 wk; Kruskal-Wallis nonparametric ANOVA; scale bar in 12 wk panel equates to 100 µm and applies to all panels. D, Pharmacological-induced plaque regression experiment, where 9-wk high fat–fed Apoe−/− mice received pravastatin (40 mg/kg of body weight/day) within their drinking water (statin) or drinking water alone (control) during 9 wk further high-fat feeding; n=10/group; ***P<0.001; 2-tailed Student t test; scale bar in control panel equates to 100 µm and applies to both panels.