
Fig. 2.
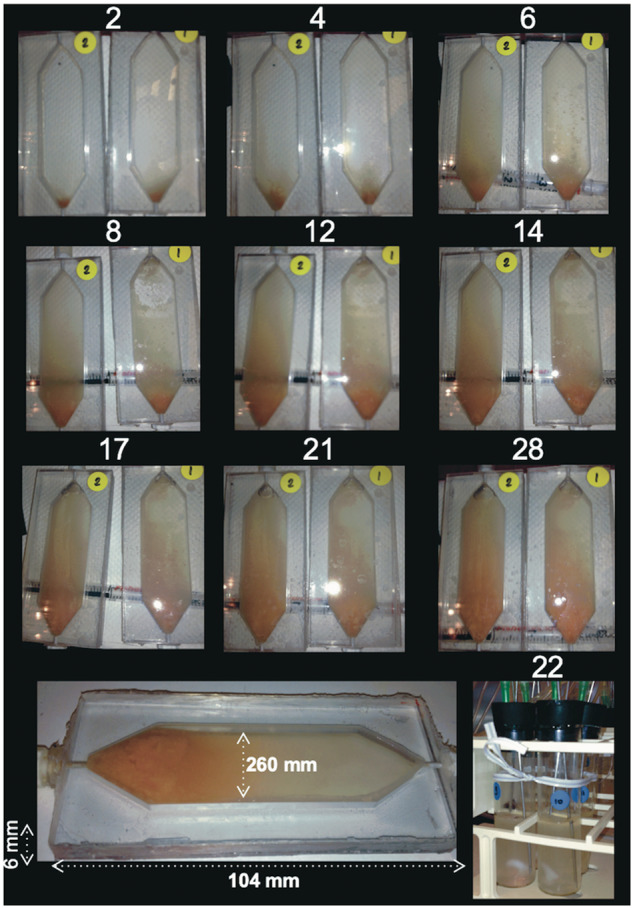
Photograph depicting biofilm growth over time in two replicate flow cells (time in days is indicated above each picture) and chemostats (bottom right). The bottom flow cell image shows the dimensions.
Official websites use .gov
A
.gov website belongs to an official
government organization in the United States.
Secure .gov websites use HTTPS
A lock (
) or https:// means you've safely
connected to the .gov website. Share sensitive
information only on official, secure websites.
Photograph depicting biofilm growth over time in two replicate flow cells (time in days is indicated above each picture) and chemostats (bottom right). The bottom flow cell image shows the dimensions.