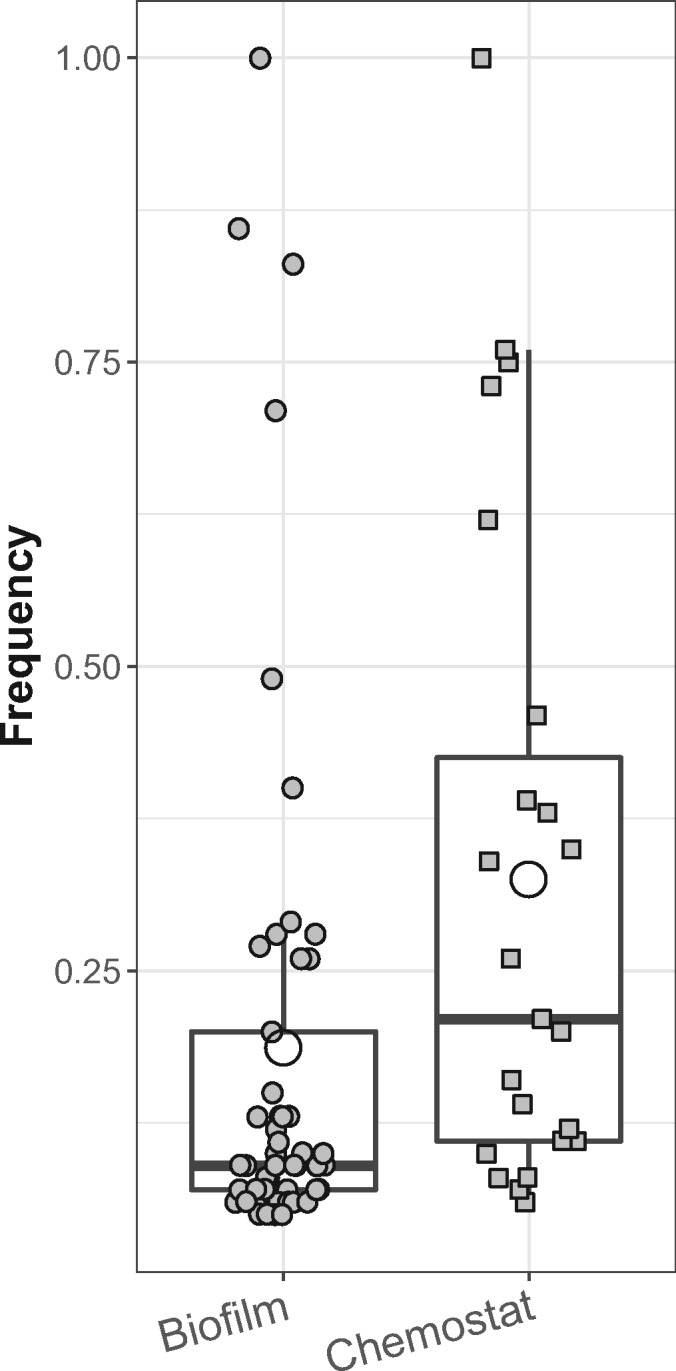
Fig. 6.

Frequency of mutations identified in biofilm and chemostat populations. Boxes represent the median (horizontal line) and the first and third quartiles, and the whiskers the lower and upper 1.5 interquartile range. The open circles represent the average frequency for each environment, which was lower for the biofilms than for the chemostats (P < 0.05).
