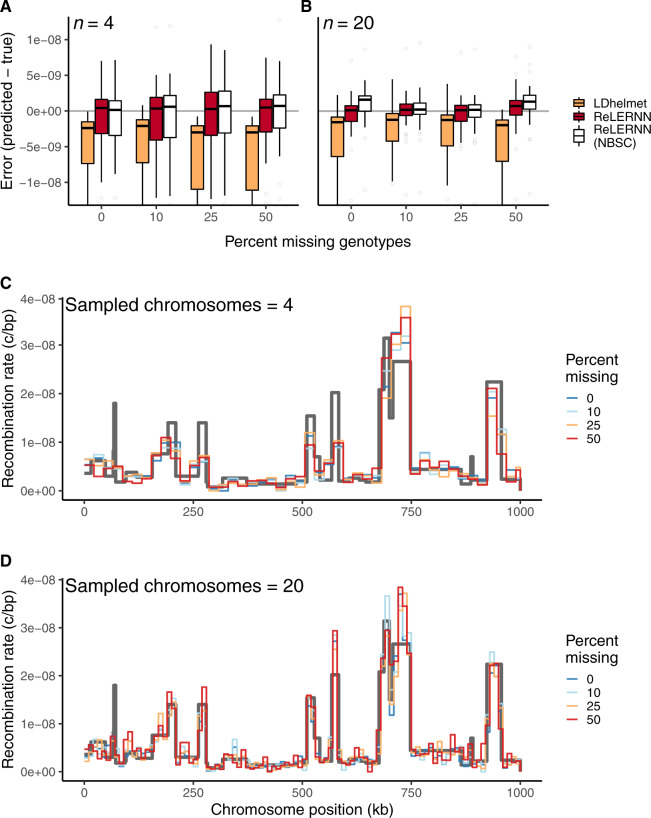
Fig. 5.
(A) Distribution of raw error () for LDhelmet and ReLERNN when presented with varying levels of missing genotypes for simulations with n = 4 and (B) n = 20 chromosomes. (C) Fine-scale rate predictions generated by ReLERNN for a 1-Mb recombination landscape (gray line) simulated with varying levels of missing genotypes, for n = 4 and (D) n = 20 chromosomes.

