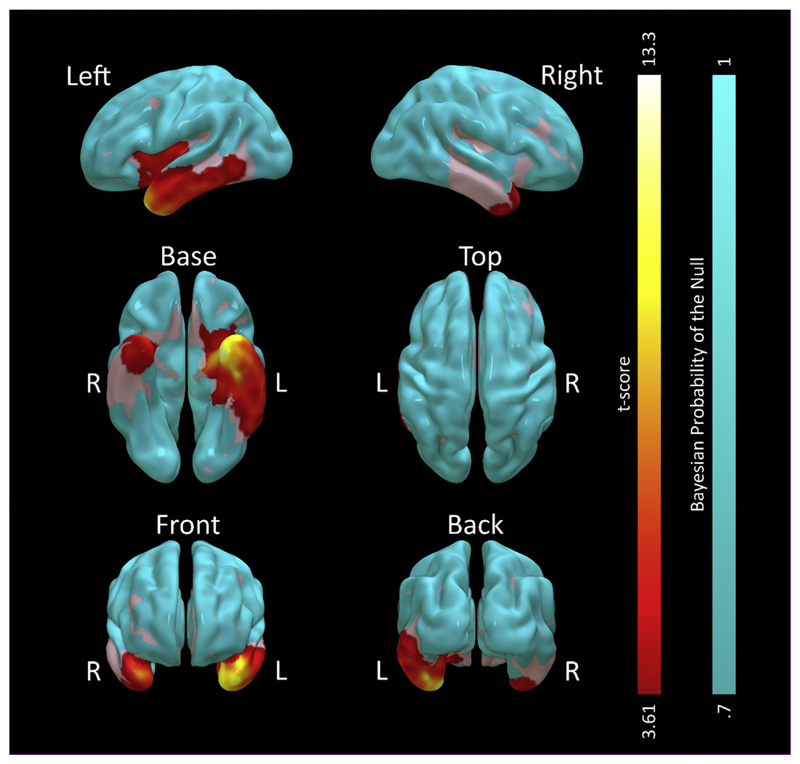
Fig. 2.
Voxel based morphometry statistical comparison of 8 participants with SD against 14 age-matched controls. Redyellow shaded areas represent t-scores for greater grey matter volume in the control group on the frequentist analysis, cluster thresholded at FWE p < .05 with a height threshold at uncorrected p < .001. No voxels demonstrated greater grey matter volume in the patient group. Cyan areas represent those that had strong evidence for normal grey matter volume in SD compared to controls on the Bayesian analysis (Bayesian probability of the null >.7, cluster volume>1 cm3). Uncoloured (grey) areas had no strong evidence for or against atrophy.

