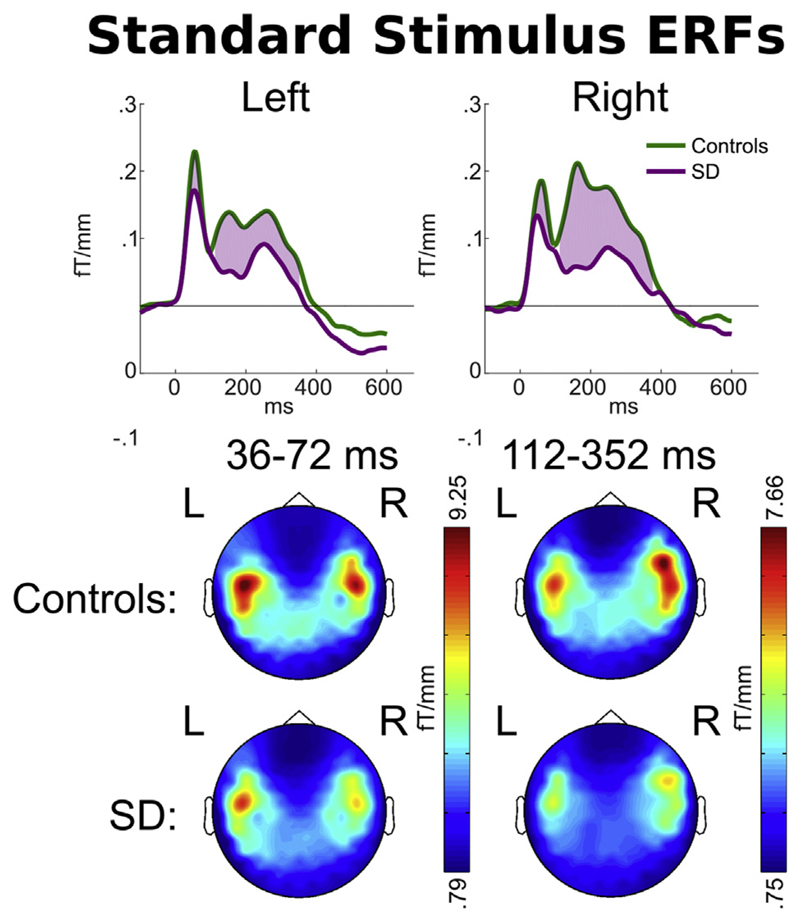
Fig. 3.
Upper: Magnetic field power recorded by planar gradiometers at the scalp locations of peak overall response [(−47, −9) and (47, −9)] to the standard word overlying each hemisphere. Responses are time-locked to word onset. Purple shading indicates time periods at which a statistical difference was observed in signal magnitude between patients and controls. Lower: Scalp signal topographies for each group, averaged within each period of statistically significant difference.

