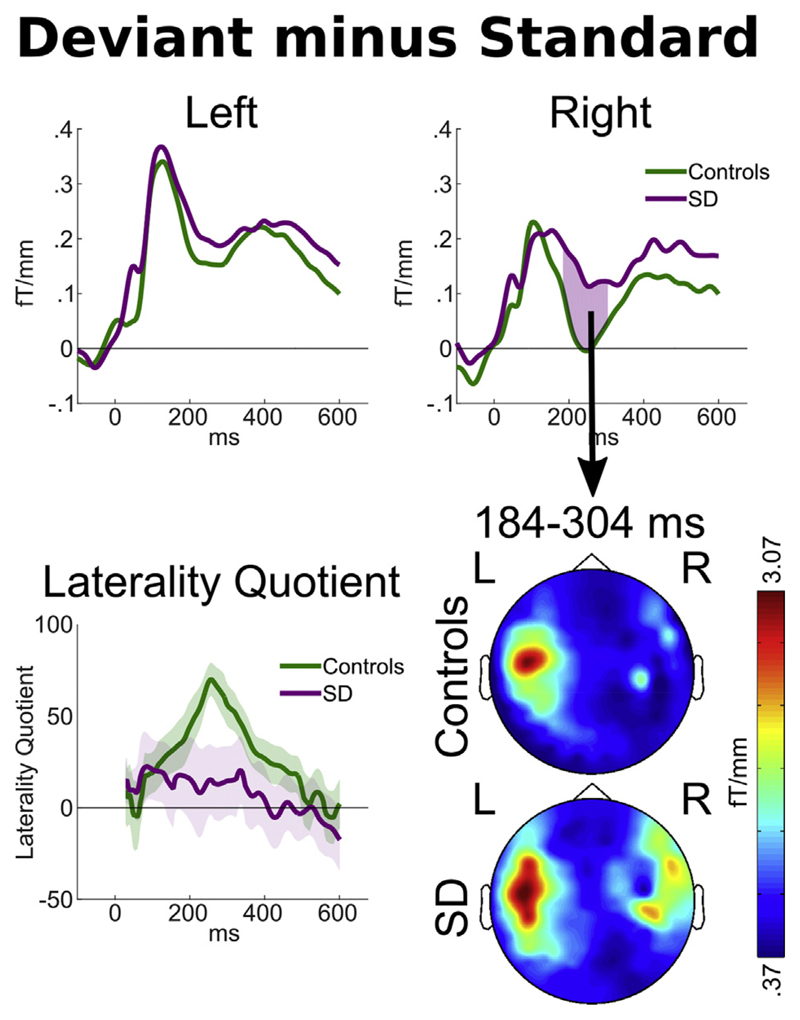
Fig. 4.
Upper: Magnetic field power recorded by planar gradiometers at the scalp locations of overall peak contrast between the average responses to all deviant words minus all standard words, relative to standard word offset. Pink areas indicate statistically significant group by deviance interactions as defined by p < .05 sustained for ≤7 samples, exceeding the duration of temporal smoothing. Lower left: The laterality quotient of the deviance response for each group. Calculated such that fully left sided deviant responses would be +100, fully right sided responses −100. The shaded areas around each line encompass ± one standard error. Lower right: Scalp signal topographies for each group, averaged across the period of the statistically significant group by condition interaction observed in the peak right-sided sensor.

