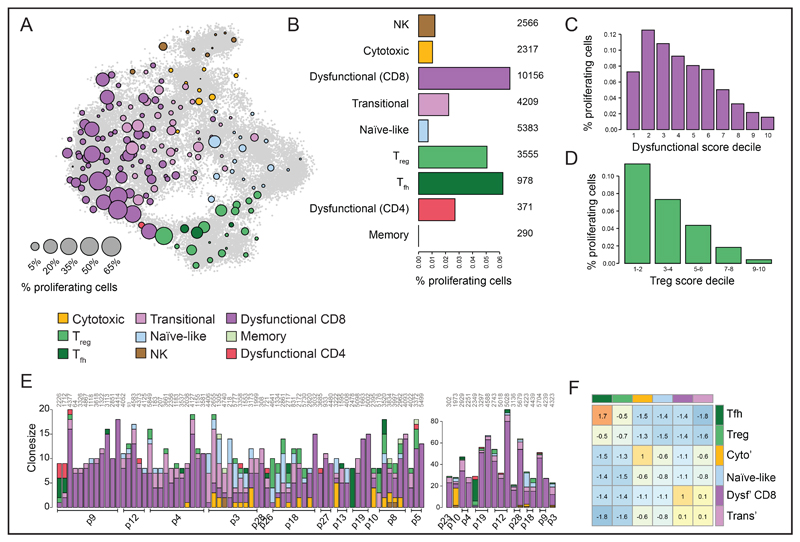
Figure 5. CD8 T cells in early dysfunctional state are highly proliferative.
A. Fraction of proliferating cells per metacell, calculated by defining a cell as proliferative by its fraction of cell cycle genes expression out of total expression. Circle size reflects the percentages of proliferating cells in the metacell, using the 2D projection as in Figure 1C. B. Percentage of proliferating cells in the different immune cell types and subtypes, number of cells per metacell group are shown on the right. C-D. Fraction of proliferating cells in dysfunctional (C) and Treg (D) groups of cells, stratifying cells by their dysfunctional score (C) and Treg score (D). Scores defined as in Figure 2. E. Cell subtype composition of T cell clones of intermediate size (shared by 8-20 cells, left) or large size (shared by more than 20 cells, right). Clones are hierarchically clustered, patient ID are shown on the bottom and clone ID on top. F. Pairwise clone sharing propensity by different T cell groups. Data depict the enrichment of the observed number of cell pairs sharing TCRs by their associated group over a control generated by multiple repetitions of random sampling of cells from individual patients, taking into account the TCR detection probability (shown in Figure S5A), while preserving the number of clones and clone sizes per patient.

