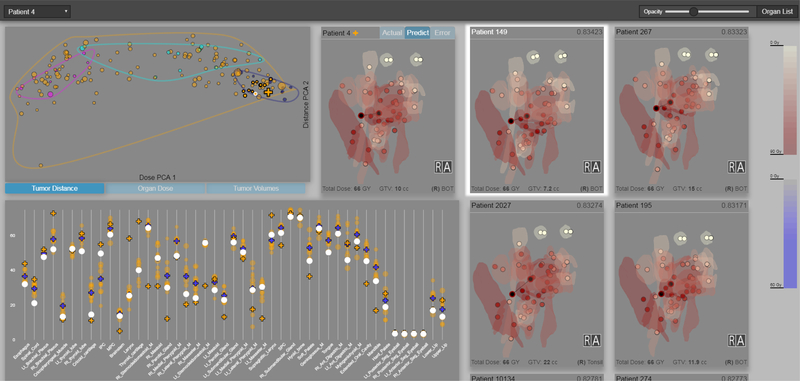
Fig. 1.
Visual computing for cohort-based radiation therapy prediction. A stylized view of the predicted radiation plan of the current patient is placed centrally; top pale markers (front and back of eyes) receive the least radiation; tumors in black receive the most. Additional RT views show the most similar patients under our novel T-SSIM metric, who contribute to the prediction; the most similar patient is currently selected for comparison. A scatterplot (left) shows 4 clusters generated through the T-SSIM metric, with the current (cross) and comparison patient highlighted. A parallel-marker encoding (bottom) shows the predicted (blue cross) per-organ dose distribution within the context of the most similar patients; spatially collocated organs are in contiguous sections of the x-axis.

