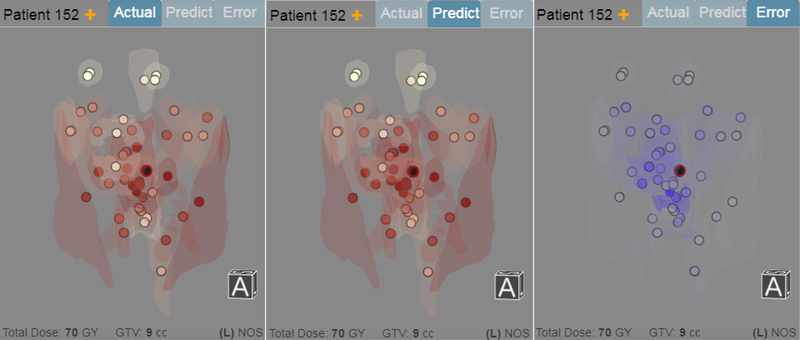
Fig. 3.
Three stylized renderings of the 3D radiation plan for Patient 152 showing the actual (left), the predicted (center), and the prediction error (right, in blue) in the radiation plan. Circular markers indicate the location of organs at risk, and black markers indicate the tumors. Red luminance is mapped to the radiation dose (higher dose mapped to darker shades) and blue luminance is mapped to error size, respectively. Transparent organ models are shown for context. The pale markers at the top correspond to the eyes, and the lowest marker is located down the spine.

