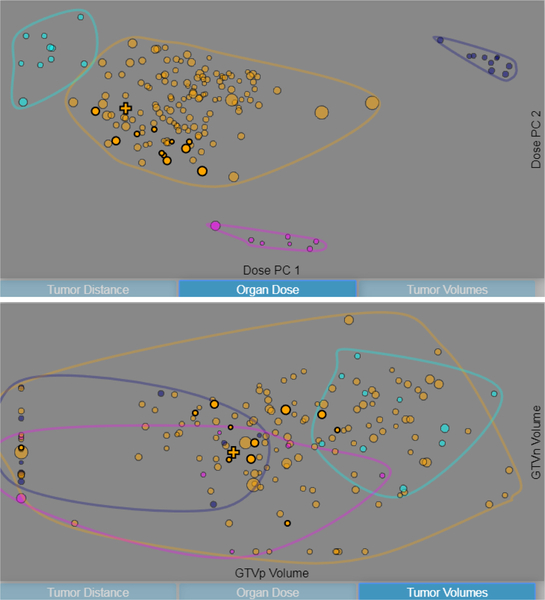
Fig. 4.
Two configurations of the scatterplot. The data can be plotted across the principal components of the radiation doses (top), primary and secondary tumor volumes (bottom), and principal components of the distances between each organ and the primary tumor volume (see Fig. 1) top left.

