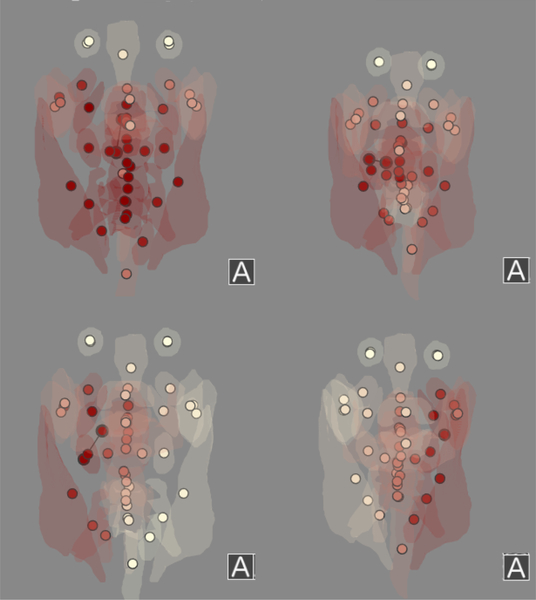
Fig. 5.
Example radiation plans for the 4 different patterns identified in the data. Top left: a plan with a higher dose to the lower-anterior throat. Top right: a plan with a ‘standard’ dose distribution, where radiation is lower in the throat and distributed to both the left and right sides of the head. Bottom right: a plan with dosing primarily to the right side of the head. Bottom left: a plan with dosing primarily to the left side of the head.

