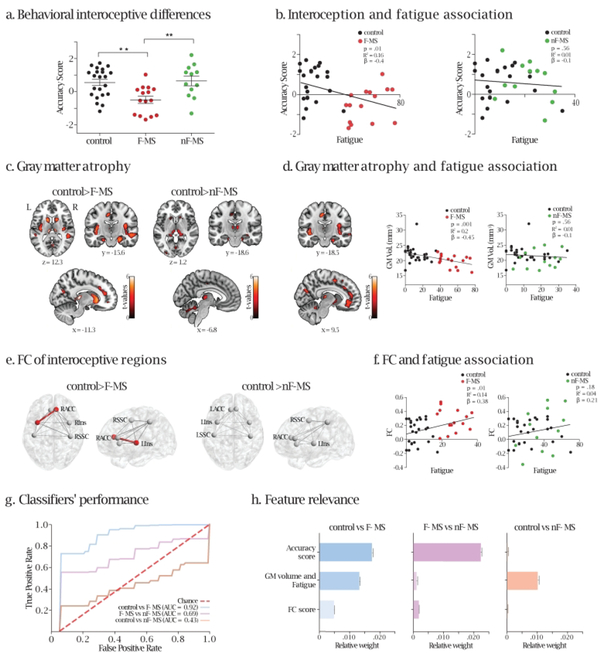
Figure 1.
a. Behavioral performance in the HBD task. The asterisks indicate decreased accuracy score (y-axis) in F-MS compared to controls and nF-MS. Higher scores indicate better performance. One-way ANOVA: F = 7.69, df = 48, p<.001, post-hoc (Tukey): Controls vs F-MS: p<.001, Controls vs nF-MS: p = .77 and F-MS vs nF-MS: p<.001. Figure 1.a., Table 1). b. Interoception and fatigue. Scatter plots of the association between accuracy score (y-axis) and fatigue (x-axis), when considering controls and F-MS (left inset), and controls and nF-MS (right inset). Higher scores on the y-axis indicate better interoceptive accuracy, while higher values on the xaxis represent elevated levels of fatigue. c. Gray matter atrophy. Left inset: Clusters of significant grey matter volume atrophy of the bilateral insula, the right ACC, the bilateral MCC, the thalamus, the caudate, and the putamen of F-MS patients compared to controls (see also Supplementary Table 2). Right inset: Clusters of significant grey matter volume atrophy of the left MCC, the bilateral thalamus, the caudate, and the putamen of nF-MS patients compared to controls (see also Supplementary Table 2). Uncorrected p-value < .001, extent threshold = 50 voxels. R = right; L = left. d. Association between fatigue and atrophy. An inverse regression emerged between grey matter volume and fatigue when considering F-MS and controls (left inset, uncorrected p-value < .001, extent threshold = 50 voxels) but not when considering nFMS and controls or F-MS and nF-MS (Supplementary Figure 3). Clusters of significant grey matter atrophy involve key interoceptive areas such as the insula, the ACC, and the MCC bilaterally, among other regions (Supplementary Table 2). Right inset: scatter plots of the association between grey matter volume of the areas of significant differences between controls and F-MS patients (y-axes) and fatigue (x-axes), for controls and F-MS (left, p=.001, R2=0.2, β = −0.45) and controls and nF-MS (right, p=.56, R2=0.01, β = −0.1). e. FC of interoceptive regions. ROI analysis including the insula, the ACC, and the SSC bilaterally showed increased connectivity between the right ACC and the left insula in F-MS compared to controls (left panel, p=.002, t=−3.1, pFDR=0.04). No difference in connectivity was found between controls and nF-MS patients (right side). f. Associations between FC and fatigue. Scatter plots of the association between FC (y-axes) and fatigue (x-axes) for controls and F-MS patients (left) and for controls and nF-MS patients (right). Higher scores on the y-axis indicate increased FC values, while higher values on the x-axis represent elevated levels of fatigue. g. Supervised learning models’ performance. Mean ROC curves of 200 iterations over a five-fold cross-validation for each SVM, where true positive rate (TPR or sensitivity) is presented along the y-axis and false positive rate (FPR or 1 – specificity) is displayed along the x-axis. The higher the area under the curve (AUC) score, the better the classifier’s performance. h. Feature relevance. Mean relative weight by feature for each SVM, obtained after computing their permutation importance in every iteration. Higher values indicate a greater contribution to classifier’s performance, while those close to zero are most likely to be non-informative (or irrelevant) since they do not improve differentiation between classes (or groups). RACC: right anterior cingulate cortex; LACC: left anterior cingulate cortex; RIns: right insula; LIns: left insula; RSSC: right somatosensory cortex; LSSC: left somatosensory cortex. GM: gray matter.

