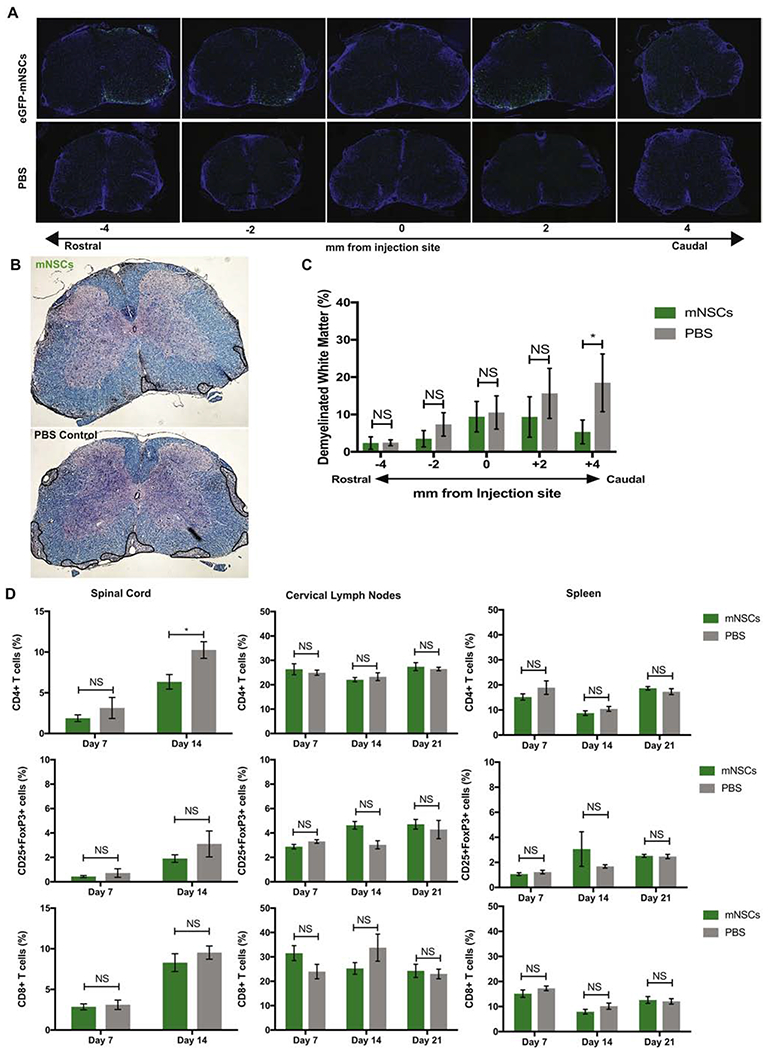
Figure 1. Mouse Neural Stem Cells engraft, migrate and remyelinate in an EAE mouse model of MS with no effect upon CNS immune environment.

(A) Representative serial sections of spinal cord rostral and caudal to the site of implantation (T9) show that eGFP-mNSCs (green) survive 28 days post-transplantation and migrate towards areas of demyelination compared to PBS treated controls. Nuclei are stained with DAPI (blue) (B) Representative brightfield images of coronal spinal cord sections from eGFP-mNSC (n= 12) or PBS control (n= 13) transplanted animals stained with luxol fast blue (LFB) and counterstained with hematoxylin and eosin (H&E), areas of demyelinated white matter outlined in black. (C) Quantification of demyelination in the ventral white matter of eGFP-mNSC (n= 12) or PBS control (n= 13) transplanted mice revealed significantly (p<0.05) reduced demyelination at sections caudal to the injection site. (D) Quantification of the frequency of adaptive immune cell populations CD4+, CD4+CD25+FoxP3+ and CD8+ T cell subsets within the spinal cord, draining cervical lymph nodes, and spleen of eGFP-mNSC (n= 5) or PBS control (n= 5) injected mice revealed no significant difference in cell populations at day 7 p.t. FACS plots were analyzed and quantified by gating on lymphocytes, excluding forward and side scatter doublets, CD4+ or CD8+ and CD4+CD25+FoxP3+. Sample gating strategy is shown in Supplemental Figure 1. Data represents two independent experiments. 14 days p.t. there was a slight, but significant (*p= 0.0182) decrease in frequency of CD4+ T cells within the spinal cord of mice receiving eGFP-mNSCs 14 days p.t., however no significant difference in the frequency of CD4+ T cells, CD8+ T cells and CD4+CD25+FoxP3+ Tregs in the cLN and spleen 7, 14 or 21 days p.t. or in the SC at day 7 or 21 p.t. For (C), day 28 p.t. demyelinated white matter analysis eGFP-mNSCs (n=12) and control PBS (n=13). Data is presented as average ± SEM and analyzed using one-way ANOVA followed by Tukey’s multiple comparison test. For (D), day 7 p.t. analysis eGFP-mNSCs (n=5) and control PBS (n=5). Data is presented as average ± SEM and analyzed using a two-way ANOVA with a Sidak’s multiple comparisons test.
