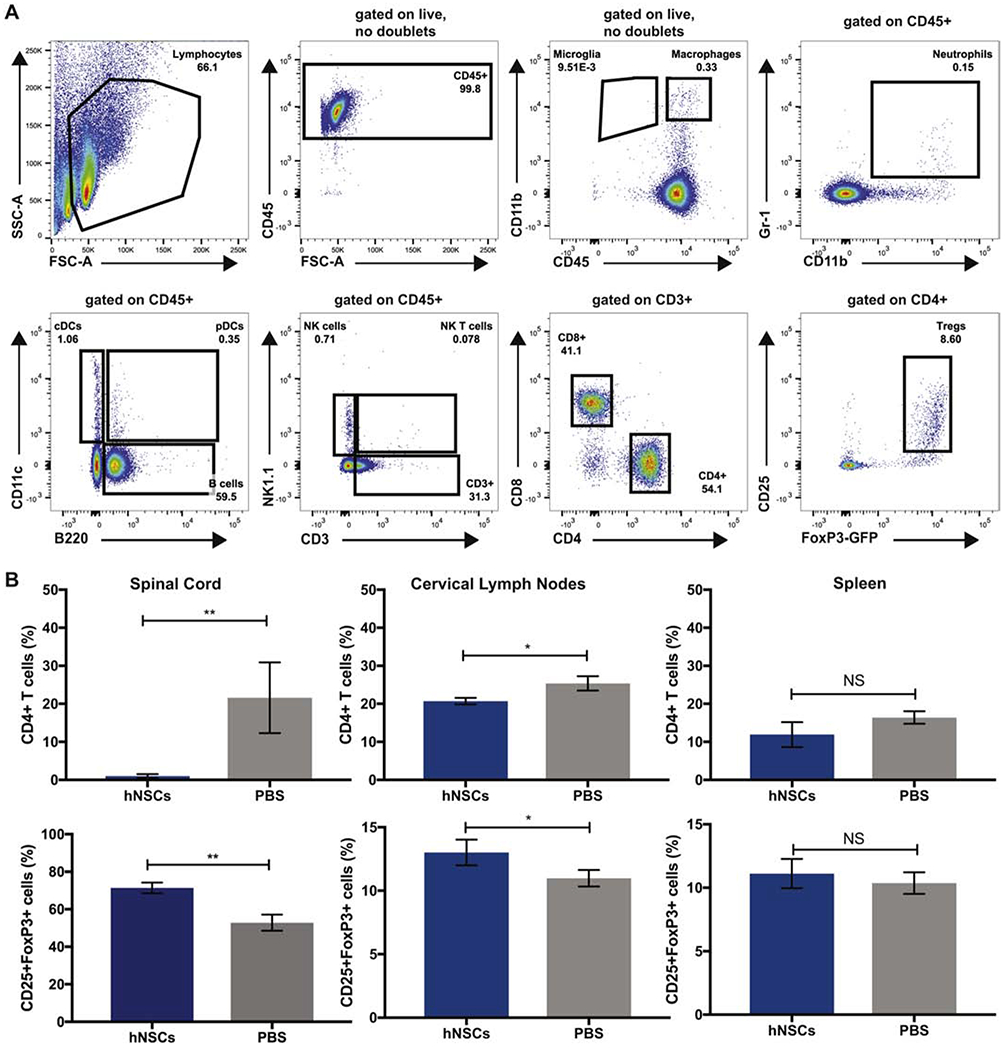
Figure 4. Increase in CD4+CD25+FoxP3+ regulatory T cells in the spinal cord and cervical lymph nodes following hNSC Transplant.

(A) Representative FACS plots showing gating strategy for immune cells. (B) Quantification of the frequency of CD4+, CD4+CD25+FoxP3+ and CD8+ T cell subsets 7 days p.t. from hNSC (n=3) or PBS transplanted (n=3) mice demonstrated a significant (p=0.006) decrease in the percentage of CD4+ T cells within the spinal cord (top left) and draining cervical lymph nodes (top middle). An increase in frequency of CD4+CD25+FoxP3+ Tregs was observed in the spinal cord (lower left) and a significant (p=0.004) increase infrequency of CD4+CD25+FoxP3+ Tregs was observed in the draining cervical lymph nodes (lower middle) of hNSC transplanted mice. A difference in CD4+, CD4+CD25+FoxP3+ cells was not observed in the spleen. Data represents three independent experiments. Data is presented as average ±SEMand analyzed using an unpaired, two-tailed T-Test.
