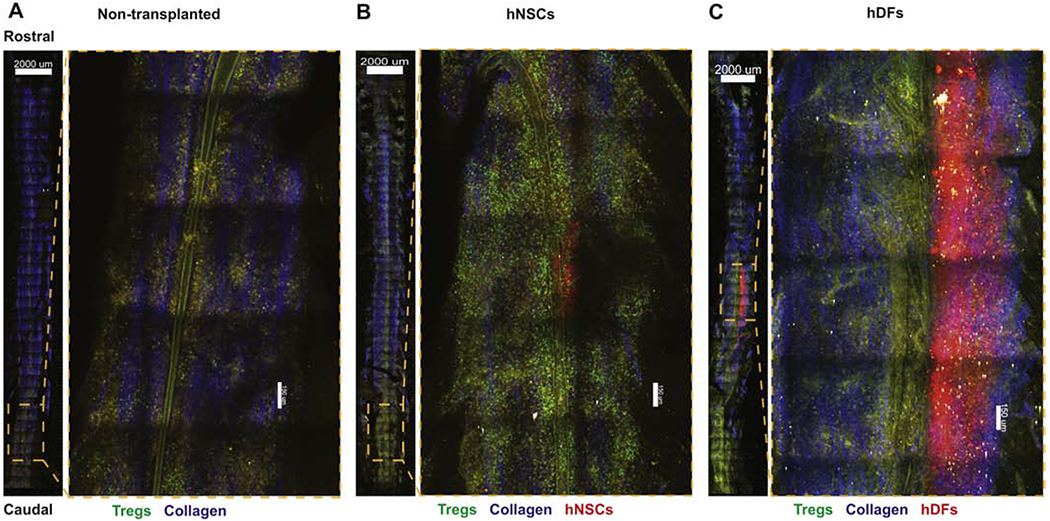
Figure 6. Tregs accumulate at the site of hNSC injection in the EAE Spinal cord.

Representative 2-photon-microscopy-derived spinal cord montage and magnified images showing distribution of FoxP3EGFP Tregs (green), transplanted cell trace yellow (CTY) labeled hNSCs or hDFs (red), second-harmonic signal from collagen (blue), and autofluorescent structures (yellow) in the ventral side of the spinal cord, 3 days p.t. of mice that were non-transplanted (n=3) (A), received hNSCs (n=3) (B), or hDFs (n=3) (C). Images are maximal intensity projections through the z-axis, ventral-dorsal (750 μm), scale bar (overview) = 2000 μm; scale bar (magnification) = 150 μm.
