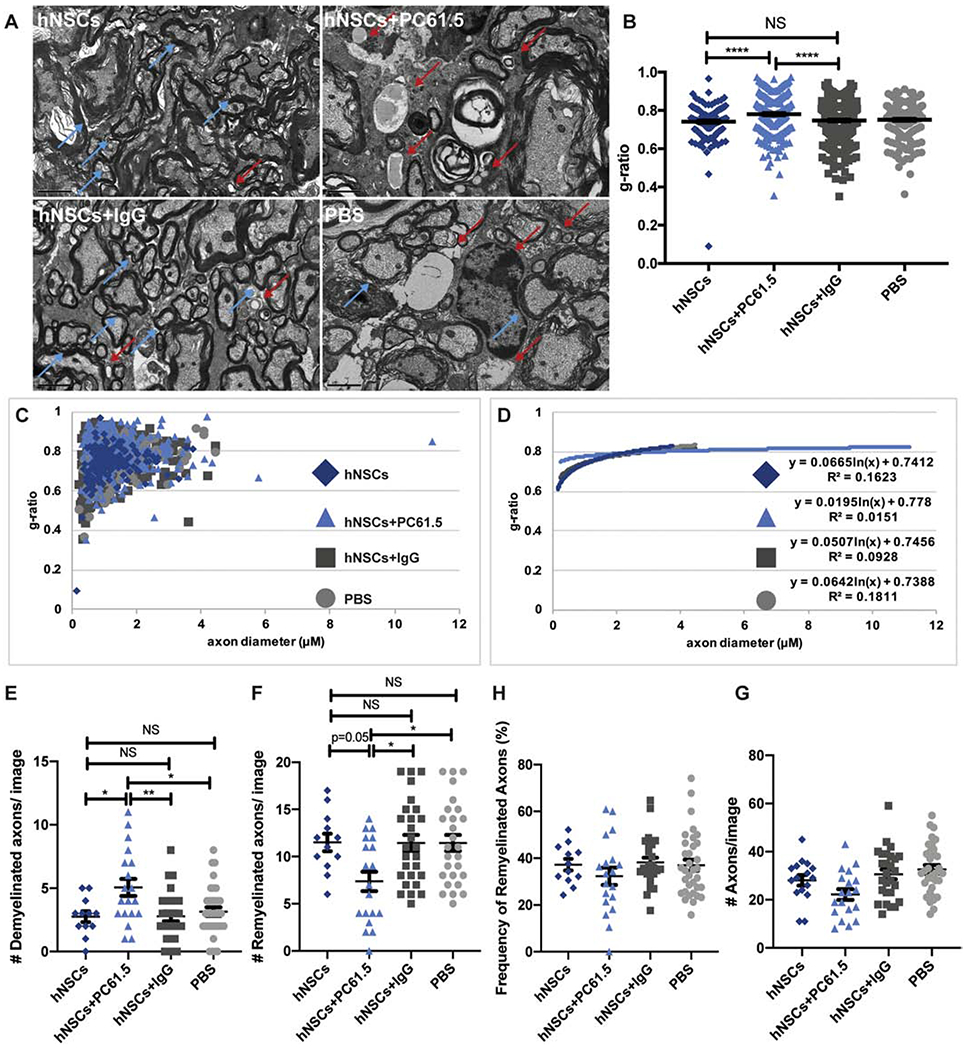
Figure 7. Regulatory T cells are necessary for remyelination following hNSC transplant.

(A) Representative electron micrographs of coronal spinal cord sections from hNSCs (n=10; top, left), hNSCs+PC61.5 (n= 7; top, right), hNSCs+IgG (n= 7; bottom, left), and control PBS (n=8; bottom, right) injected mice. Demyelinated axons indicated by red arrows. Remyelinated axons indicated by blue arrows. (B) Quantification of ratio of inner axon diameter versus total myelinated fiber (g-ratio) G-ratio of hNSCs (0.7414±0.0063), hNSCs+PC61.5 (0.7808±0.0057), hNSCs+IgG (0.748±0.0049), and PBS (0.7512±0.0054). More than 200 axons were measured per group. Data is presented as average ± SEM and analyzed using one-way ANOVA followed by Tukey’s multiple comparison test. (C) Scatter plot displaying g-ratio of individual axons as a function of axonal diameter from hNSC (dark blue, diamonds), hNSC+PC61.5 (light blue, triangles), hNSC+IgG (dark grey, squares), and control PBS (light grey, circles) injected mice. More than 200 axons were measured per group. (D) Logarithmic trend lines for scatter plot displayed in C. Quantification of the number of (E) demyelinated axons, (F) remyelinated axons, (G) percentage of remyelinated axons and (H) number of total axons per EM image from mice receiving hNSCs, hNSCs+ PC61.5, hNSCs+IgG, and control PBS. For E-H, more than 200 axons were counted per group. Data is presented as average ± SEM and analyzed using one-way ANOVA followed by Tukey’s multiple comparison test. (*p<0.05**p<0.01; **p<0.001; NS is not significant).
