Fig 4.
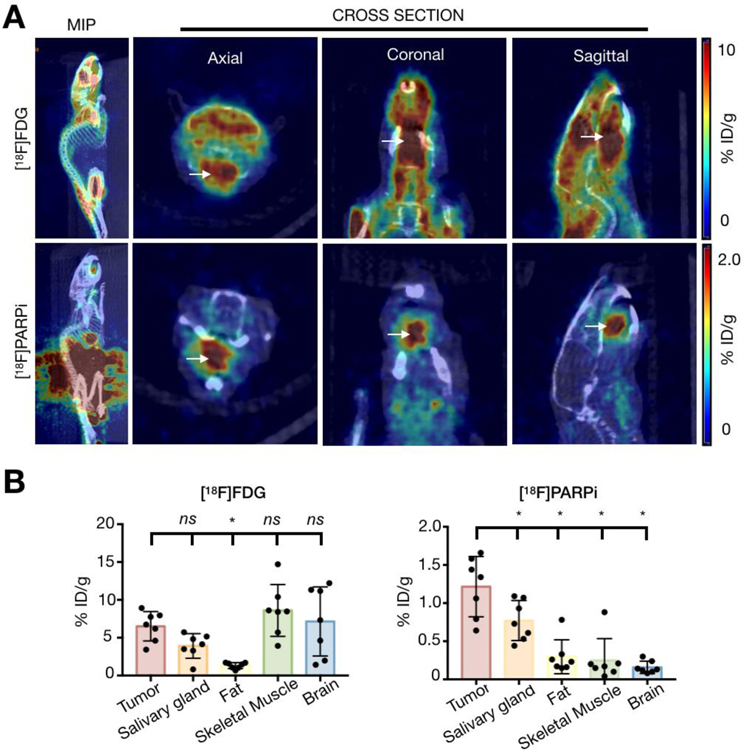
PET imaging with [18F]FDG and [18F]PARPi. Animals were inoculated on the anterior 1/3 and ventral portion of the right-hand side of the tongue with 500,000 cancer cells in 20 µL of PBS (n = 3 FaDu, n = 4 Cal 27), and tumors were allowed to proliferate for 4 weeks. Mice were injected with an average of 7.7 ± 2.2 MBq (208.1 ± 59.4 µCi) of [18F]FDG on Day 1 after tumor establishment and an average of 10.4 ± 3 MBq (282.2 ± 80.6 µCi) of [18F]PARPi on Day 2, and imaged under isoflurane anesthesia for 15 minutes, 90 minutes after injection. Animals were imaged on an INVEON small-animal micro-PET/CT scanner under isoflurane-induced anesthesia. (A) Representative images of the PET/CT scans taken from the same mouse on consecutive days. The top row shows [18F]FDG, imaged on Day 1, and the bottom row shows [18F]PARPi, imaged on Day 2. Arrows point to the tumor. Images show clear, improved tumor delineation with [18F]PARPi relative to [18F]FDG. [18F]FDG scans show high physiological uptake in the tongue, floor of mouth, and masticatory muscles. (B) Quantification of tracer uptake in different organs from PET/CT images of [18F]FDG and [18F]PARPi, respectively. Statistical analysis was performed using the Wilcoxon test in GraphPad Prism 7. Data points represent mean values, and error bars represent standard deviations. [18F]FDG quantification showed that the uptake in tumor was not significantly different from the other organs, except for fat (*P < 0.05). [18F]PARPi quantification showed that the tracer had higher uptake in tumor than in salivary glands, fat, skeletal muscle and brain (*P < 0.05). [18F]PARPi-PET allowed delineation of tumor from healthy tissue whereas [18F]FDG failed to do so.

