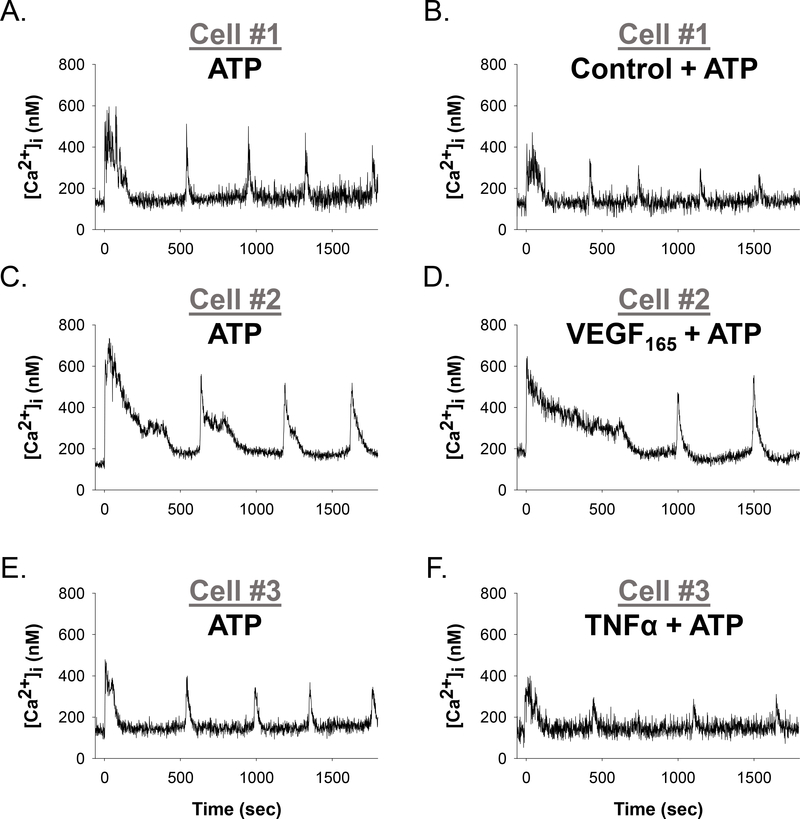
Figure 1: Representative individual HUVEC Ca2+ tracings before and after Control,VEGF165, or TNFα treatment.
Panels A, C, and E show representative HUVEC ([Ca2+ ]i) tracings with a short baseline followed by 100uM ATP stimulation (at time 0 sec), resulting in initial ([Ca2+ ]i) peak followed by repetitive Ca2+ bursts. Panel B shows the same cell as panel A, with addition of a vehicle control for 30 minutes and subsequently stimulated with ATP (at time 0 sec). Panel D shows the same cell as Panel C, with the addition of 10ng/ml VEGF165 for 30 minutes before subsequent stimulation with ATP (at time 0 sec). Likewise, Panel F shows the same cell as in Panel E, with the addition of 10ng/ml TNFα for 60 minutes before subsequent stimulation with ATP (at time 0 sec). Ca2+ The resulting Ca2+ burst loss provides an in vitro functional assay for growth factor and cytokine-mediated endothelial dysfunction as seen in PE. For Panel A to Panel B, zero burst loss; for Panel C to Panel D, 1 burst loss − 25% reduction; for Panel E to Panel F, 1 burst loss − 20% reduction.

