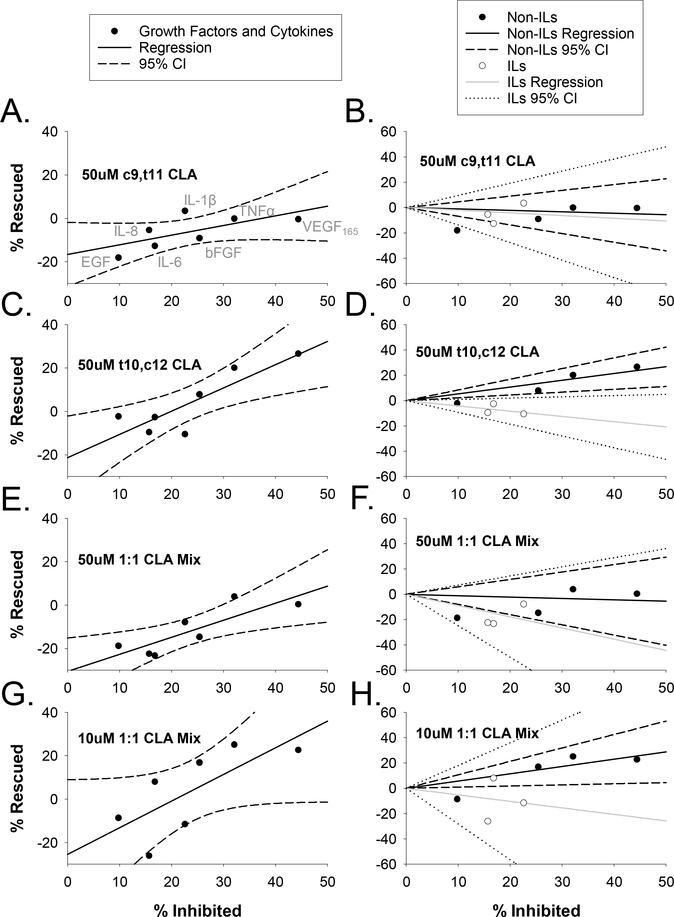
Figure 5: Regression analysis for the effect of CLA treatments on individual growth factors and cytokines.
Linear regressions were executed with percentage of bursts inhibited plotted on the x-axis and percentage “rescued” indicating change in burst numbers for all CLA and growth factor treatments from Figures 2 and 4 plotted on the y-axis. Experimental conditions are matched left (all data together; panels A,C,E,G) and right (separated into non-interleukins (Non-ILs) and Interleukins (ILs); panels B,D,F,H). All data points correspond to the same growth factors and cytokines from L to R: EGF, IL-8, IL-6, IL-1β, bFGF, TNFα, and VEGF165; as indicated in the upper left panel. For the left panels (A,C,E,G), regression lines are indicated by a solid black line and 95% confidence intervals (CI) are indicated by dashed black lines. For panels to the right (B,D,F,H), Non-ILs are indicated by black circles, black regression line, and black dashed CIs; for left panels, ILs are indicated by open circles, gray regression line, and dotted CIs.

