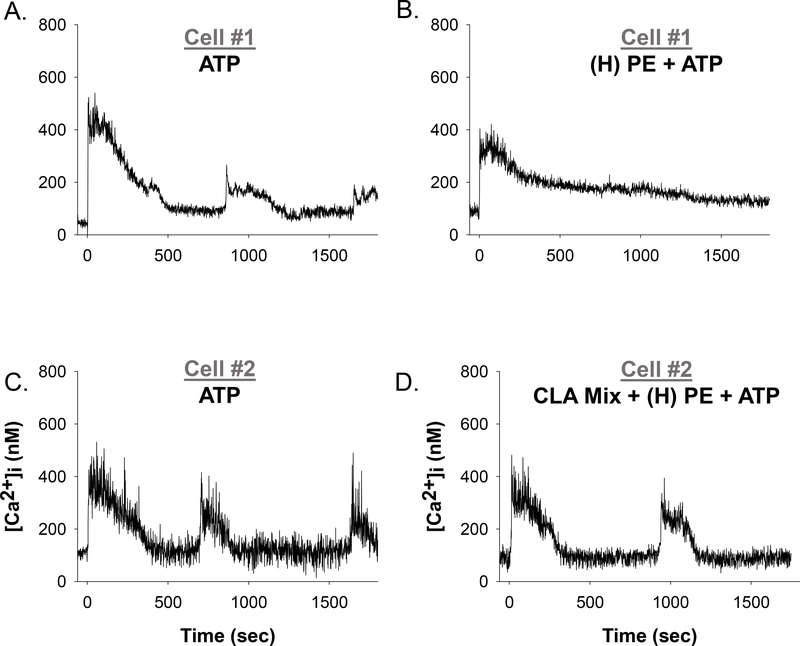
Figure 8: Representative individual HUVEC Ca2+ tracings before and after (H) PE cocktail treatment and in combinations with CLA Mix pretreatment.
Panels A and C show representative HUVEC ([Ca2+ ]i) tracings with a short baseline followed by 100uM ATP stimulation (at time 0 sec), resulting in initial ([Ca2+]i) peak followed by repetitive Ca2+ bursts. Panel B shows the same cell as panel A, with addition of (H)PE cocktail treatment for 30 minutes and subsequently stimulated with ATP (at time 0 sec). Panel D shows the same cell as Panel C, with the addition of 10um CLA mix pretreatment for 30 minutes before (H)PE cocktail treatment for 30 minutes and subsequent stimulation with ATP (at time 0 sec).

