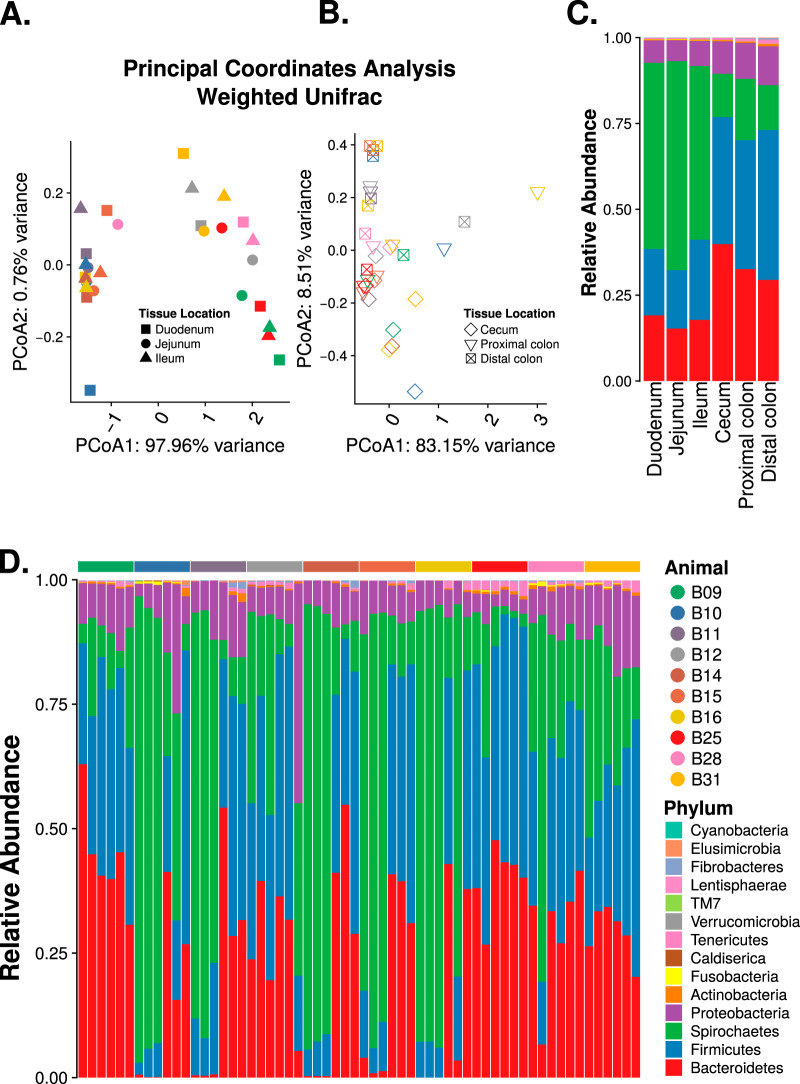
FIG 2.
Microbiota along the nonhuman primate gastrointestinal tract. Weighted UniFrac principal-coordinate analysis (PCoA) of the upper (A) and lower (B) intestinal samples. Stacked bar plot of bacterial phyla showing the average relative abundance at each of the six tissue locations (C) and at each of the six tissue locations for each sample (D), in the order of duodenum, jejunum, ileum, cecum, proximal colon, and distal colon.

