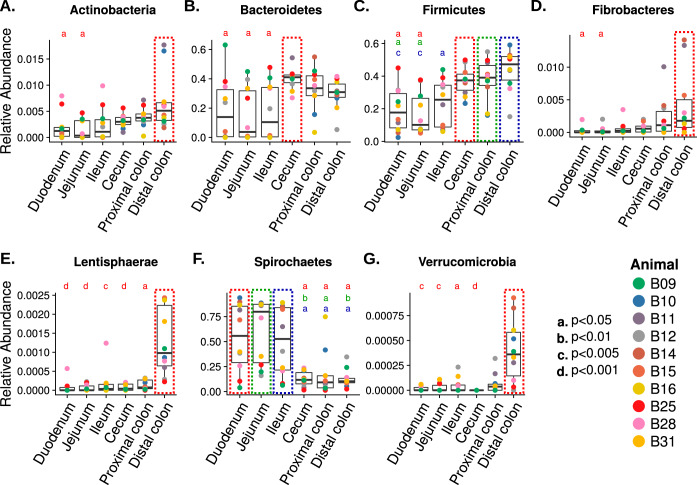
FIG 3.
Box plot of bacterial phyla with differential abundances across different tissue sites. Seven bacterial phyla have differential abundance in tissue locations highlighted in the color-dotted box. Statistical significance are indicated by lowercase letters as follows: a, P < 0.05; b, P < 0.01; c, P < 0.005; d, P < 0.001.

